Databricks cost trends
Overview
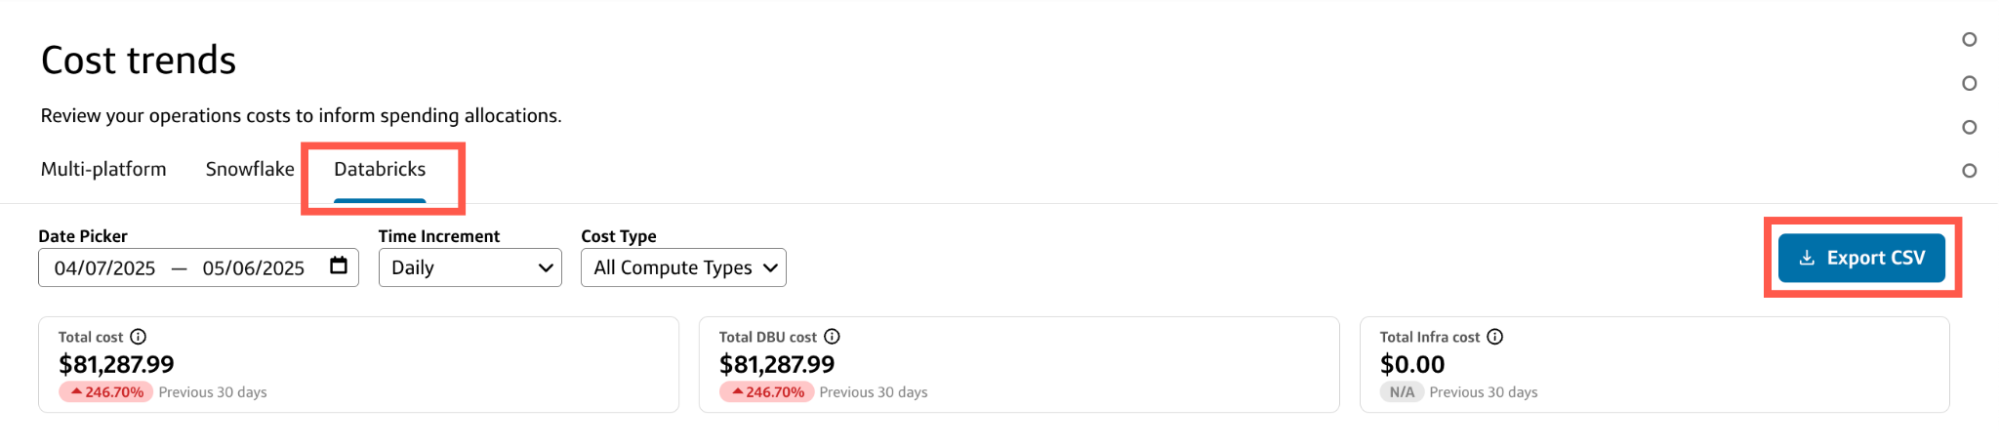
The Databricks tab displays your Databricks cost trends for the selected date range and provides additional charts and tables to break down the data.
- To download the data as a CSV report, select Export CSV and select the data you want to include in the report.
You can customize the data in both the chart and table by:
- Date picker: Select a custom data range or use one of the preset date ranges.
- Time increment: Select a time increment from the dropdown. Depending on the date range you selected, your time increment can be Daily, Weekly, or Monthly.
- Cost type: Select the compute type or All compute types to include view costs for.
The costs displayed on the Databricks tab include:
- Total cost: The sum of your costs for Databricks for the selected date range, excluding storage costs and any discounts you may receive from Databricks. Includes DBU and infrastructure costs.
- Total DBU cost: The sum of your Databricks Unit (DBU) costs for the selected date range.
- Total infra cost: The sum of your infrastructure costs for the selected date range.
Total cost
The Total cost chart or table on the Databricks tab displays the Cost and Change in cost for each Time increment in the selected date range.
- You can select a different time increment from the Total cost dropdown to change the view without affecting the other charts and tables on the Databricks tab.
- To switch between chart and table views, select the corresponding toggle in the top-right corner of the current view.
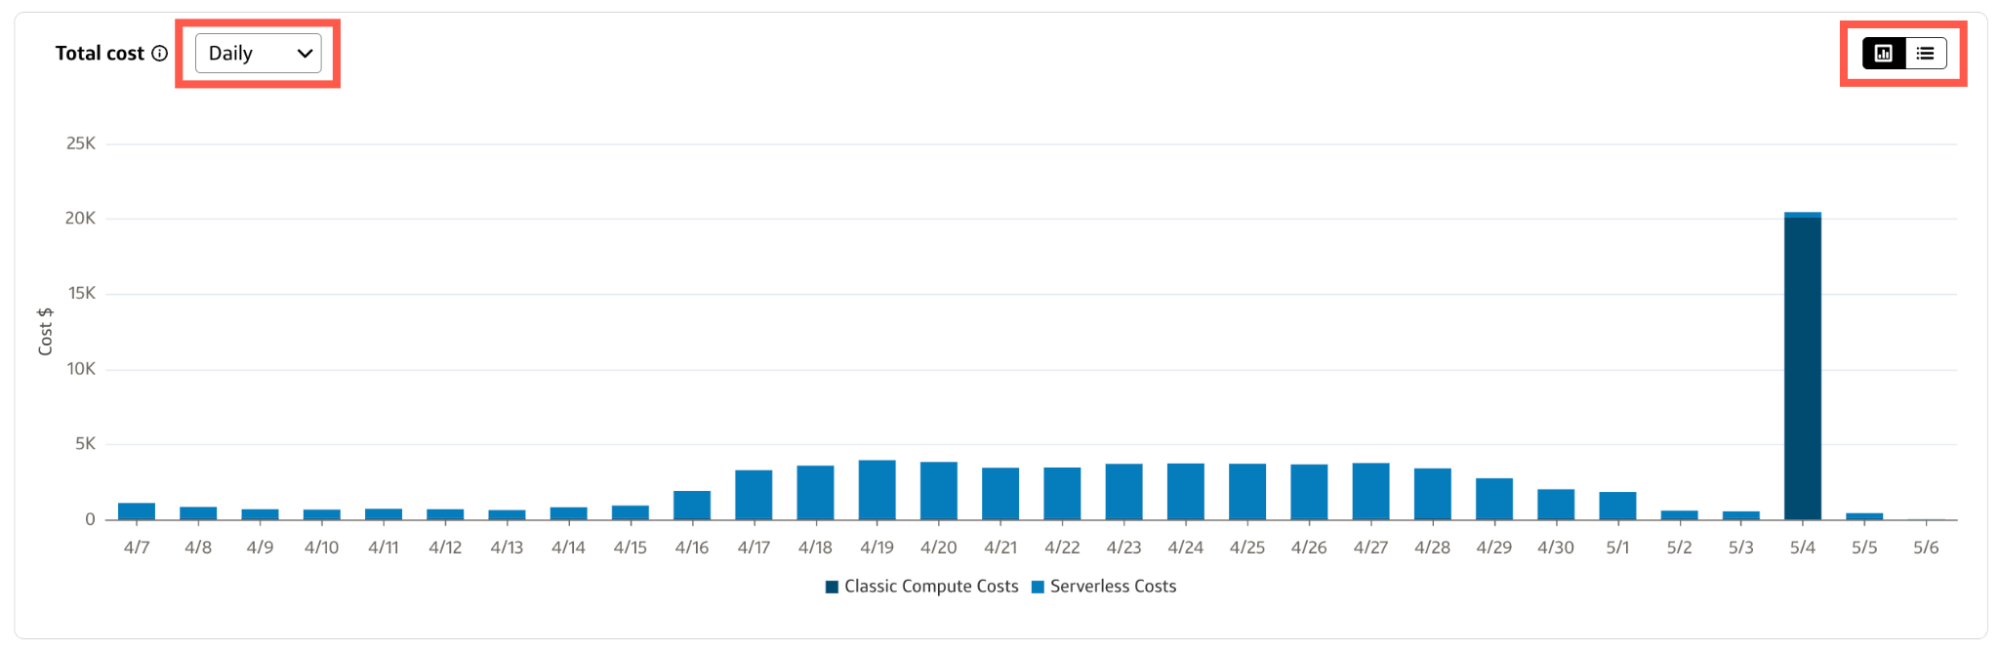
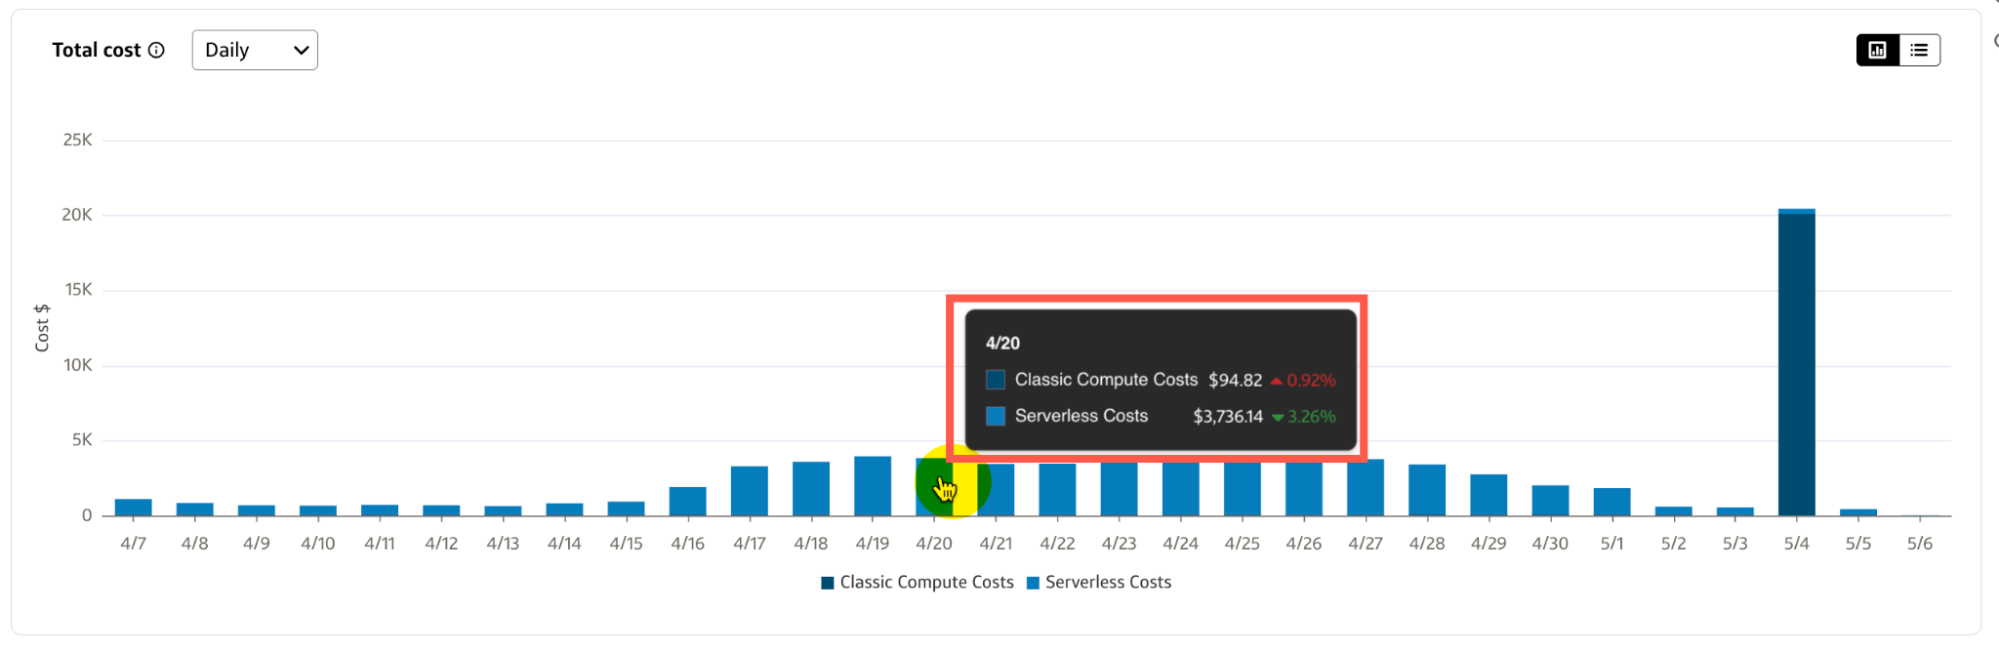
Chart view
- Hover over a bar in the chart to view the cost types, costs, and change in cost for a specific time increment.
- You can exclude or include specific cost types by selecting the Cost type below the x-axis of the chart.
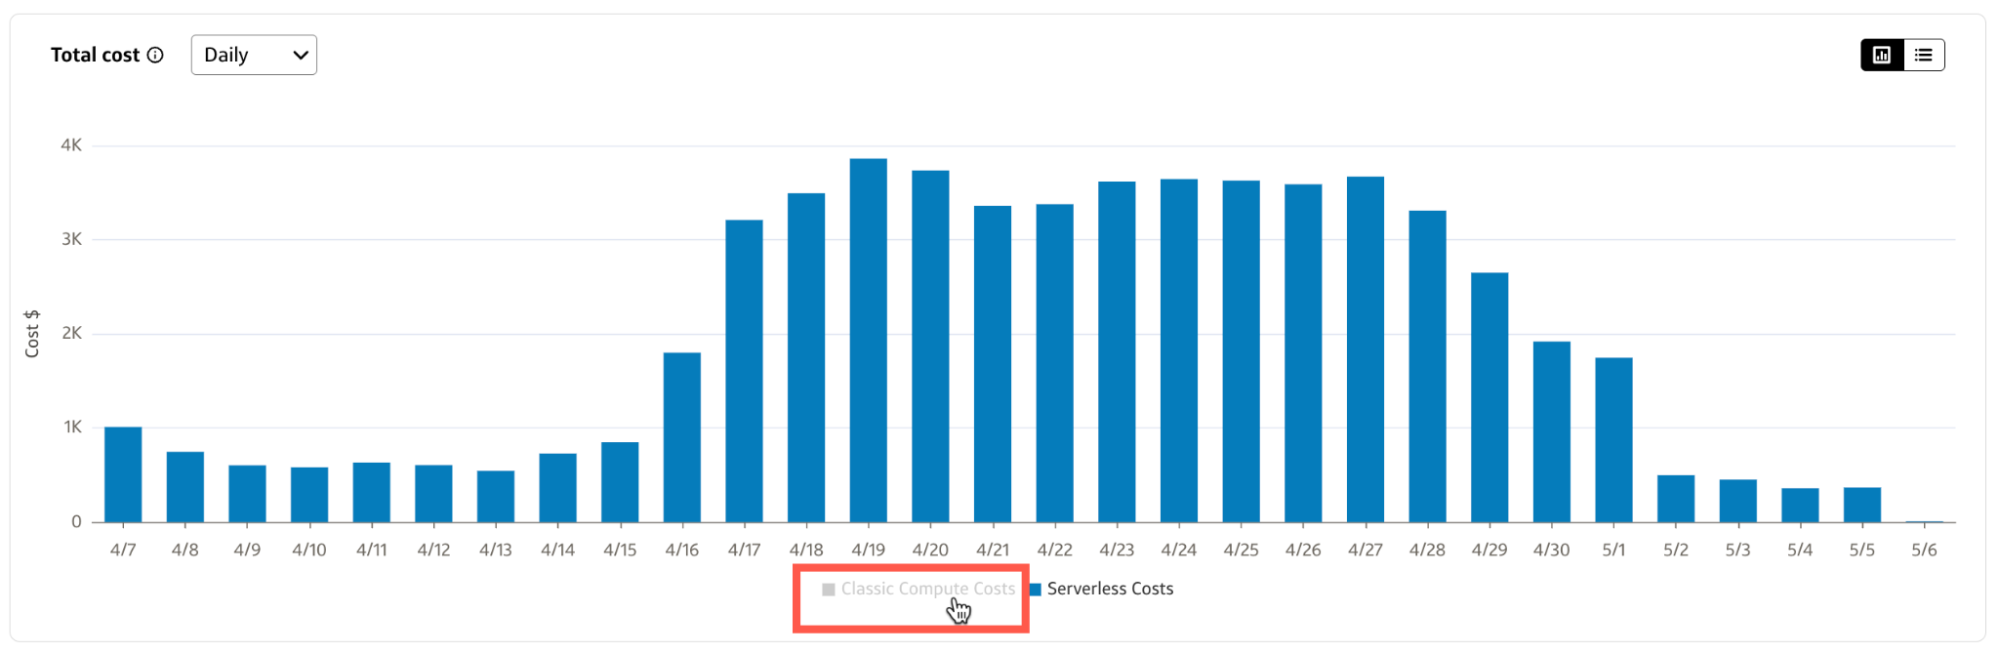
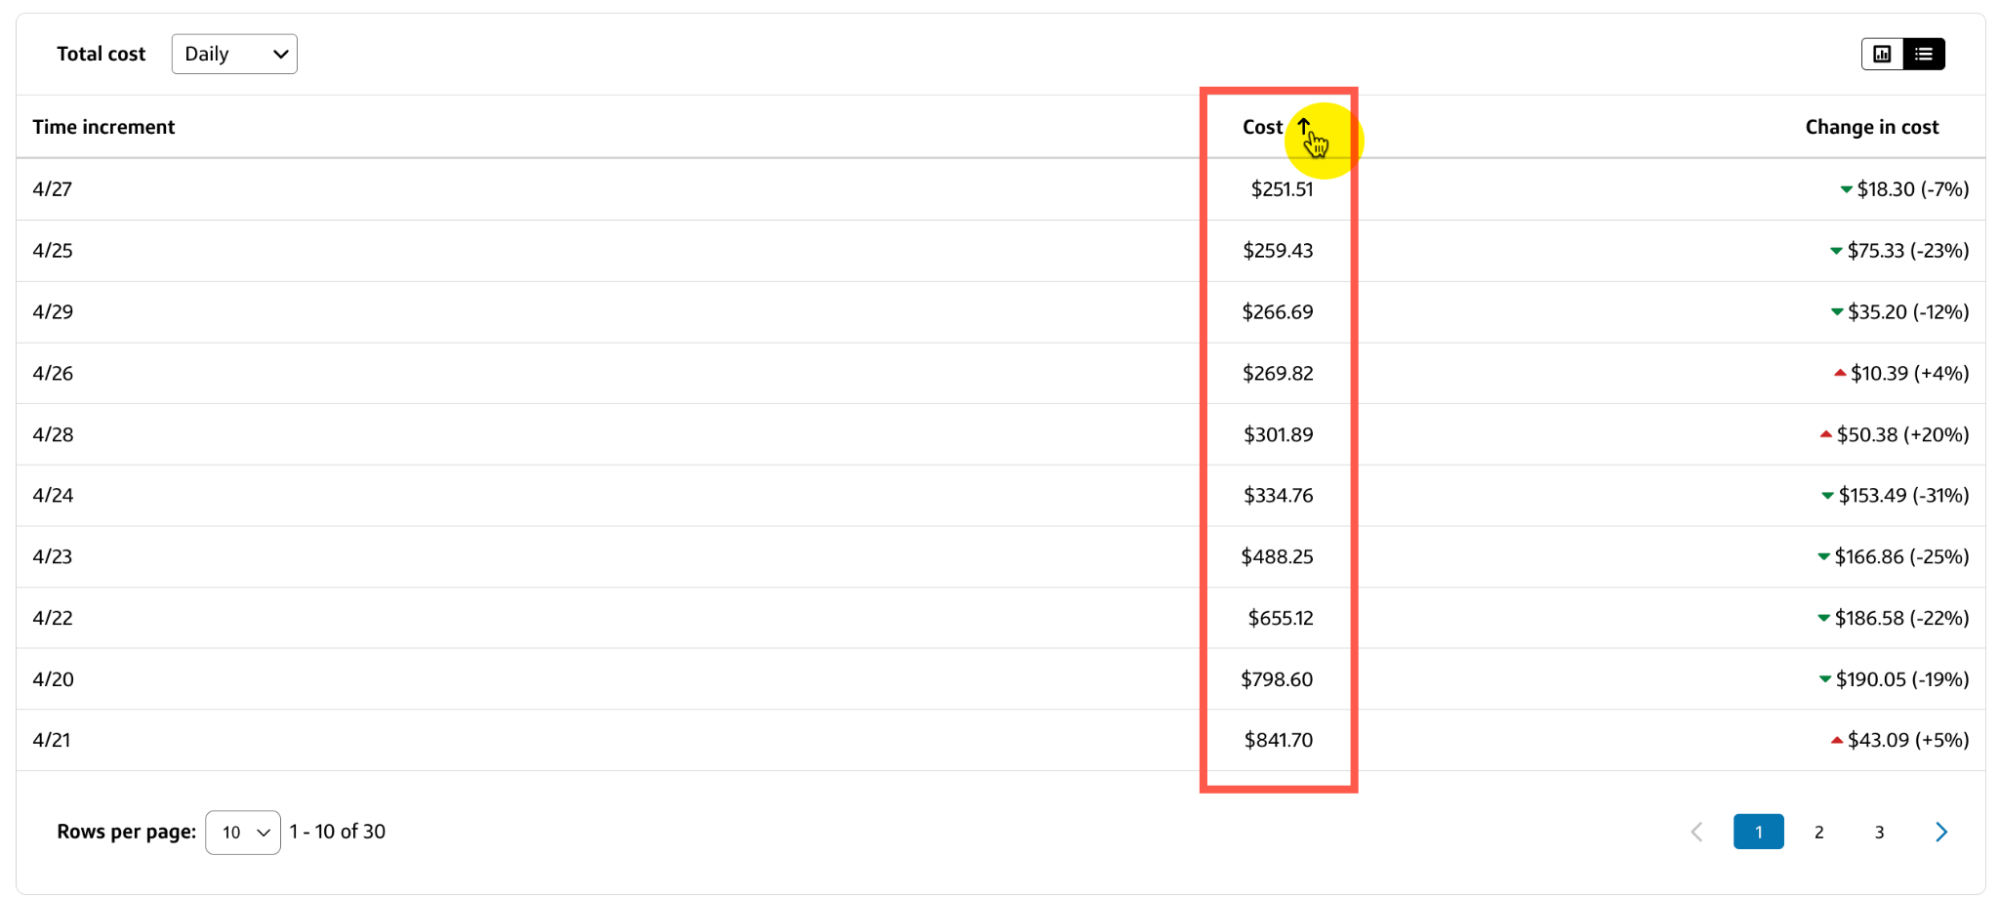
Table view
- Select a column heading to sort the table by Time increment, Cost, or Change in cost.
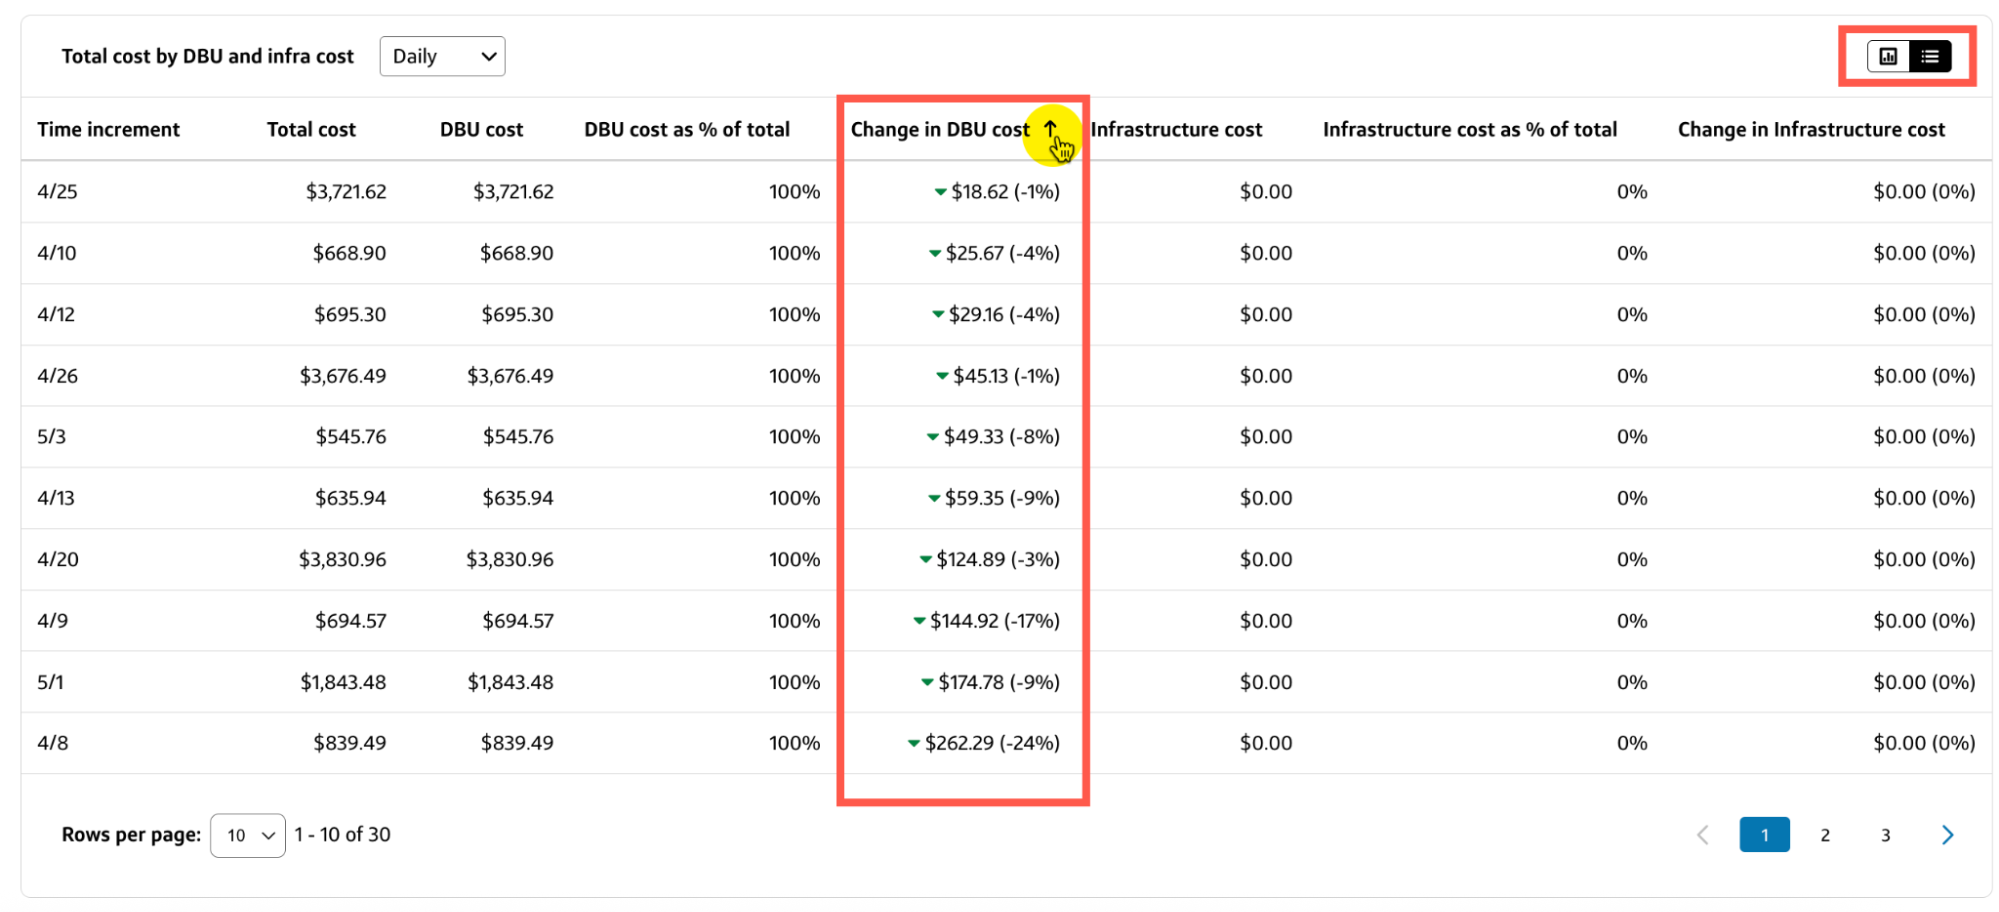
Total cost by DBU and infra cost
The Total cost by DBU and infra cost chart or table on the Databricks tab breaks down your total Databricks costs by DBU costs and infrastructure costs or your selected date range and time increment.
- You can select a different time increment from the Total cost by DBU and infra cost dropdown to change the view without affecting the other charts and tables on the Databricks tab.
- To switch between chart and table views, select the corresponding toggle in the top-right corner of the current view.
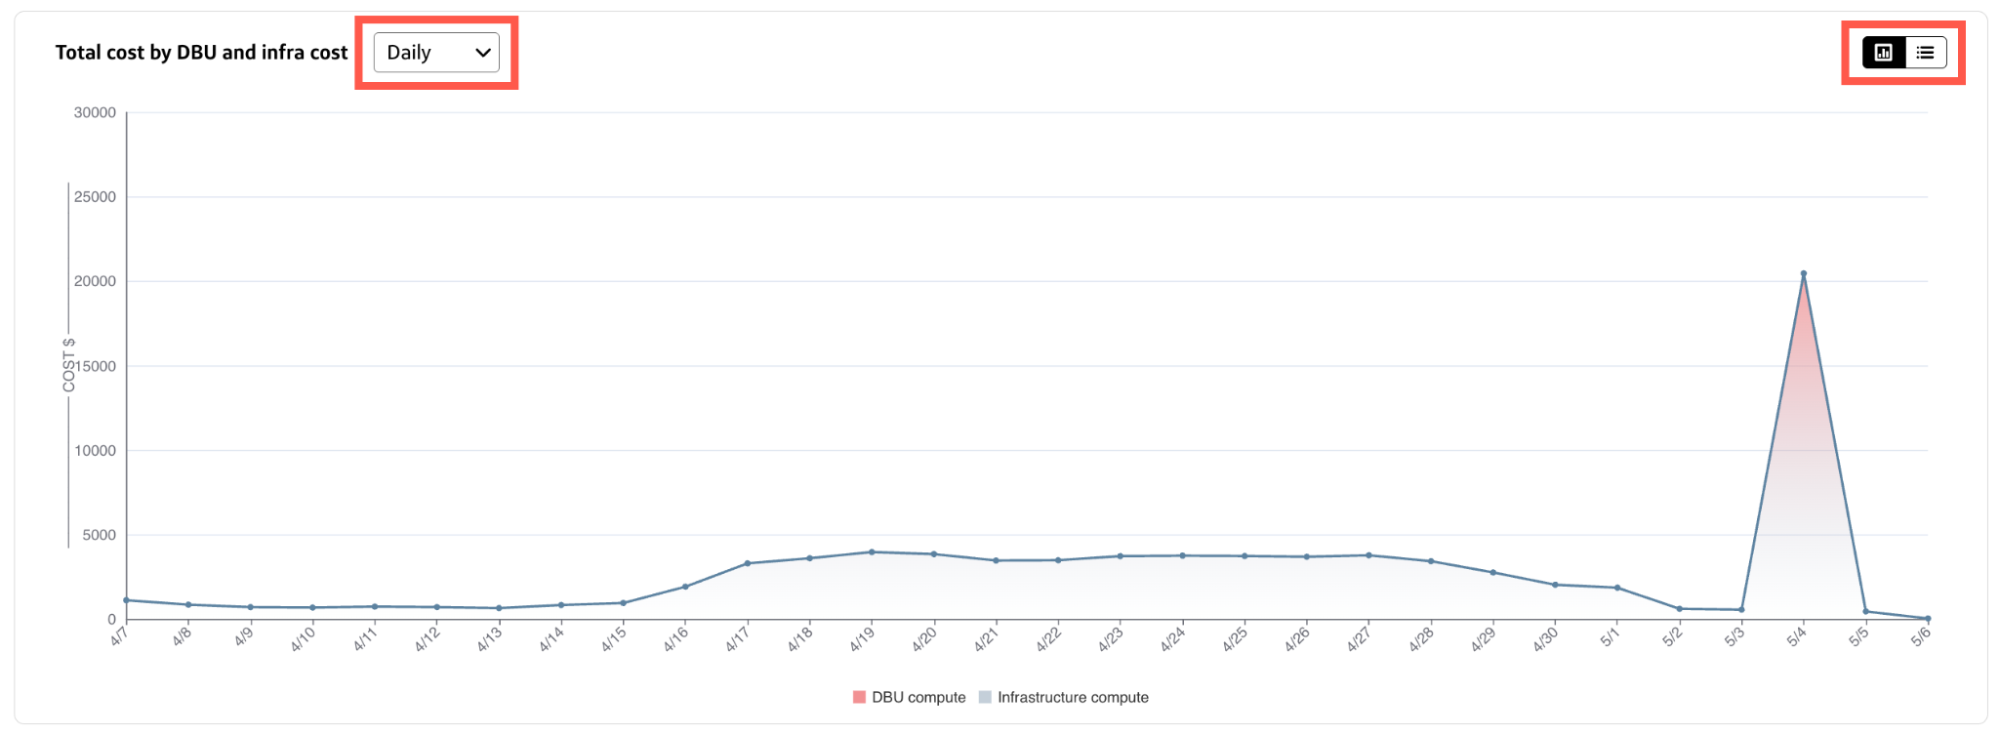
Chart view
- Hover over a point on the line to view the costs for DBU compute and Infrastructure compute for a specific time increment.
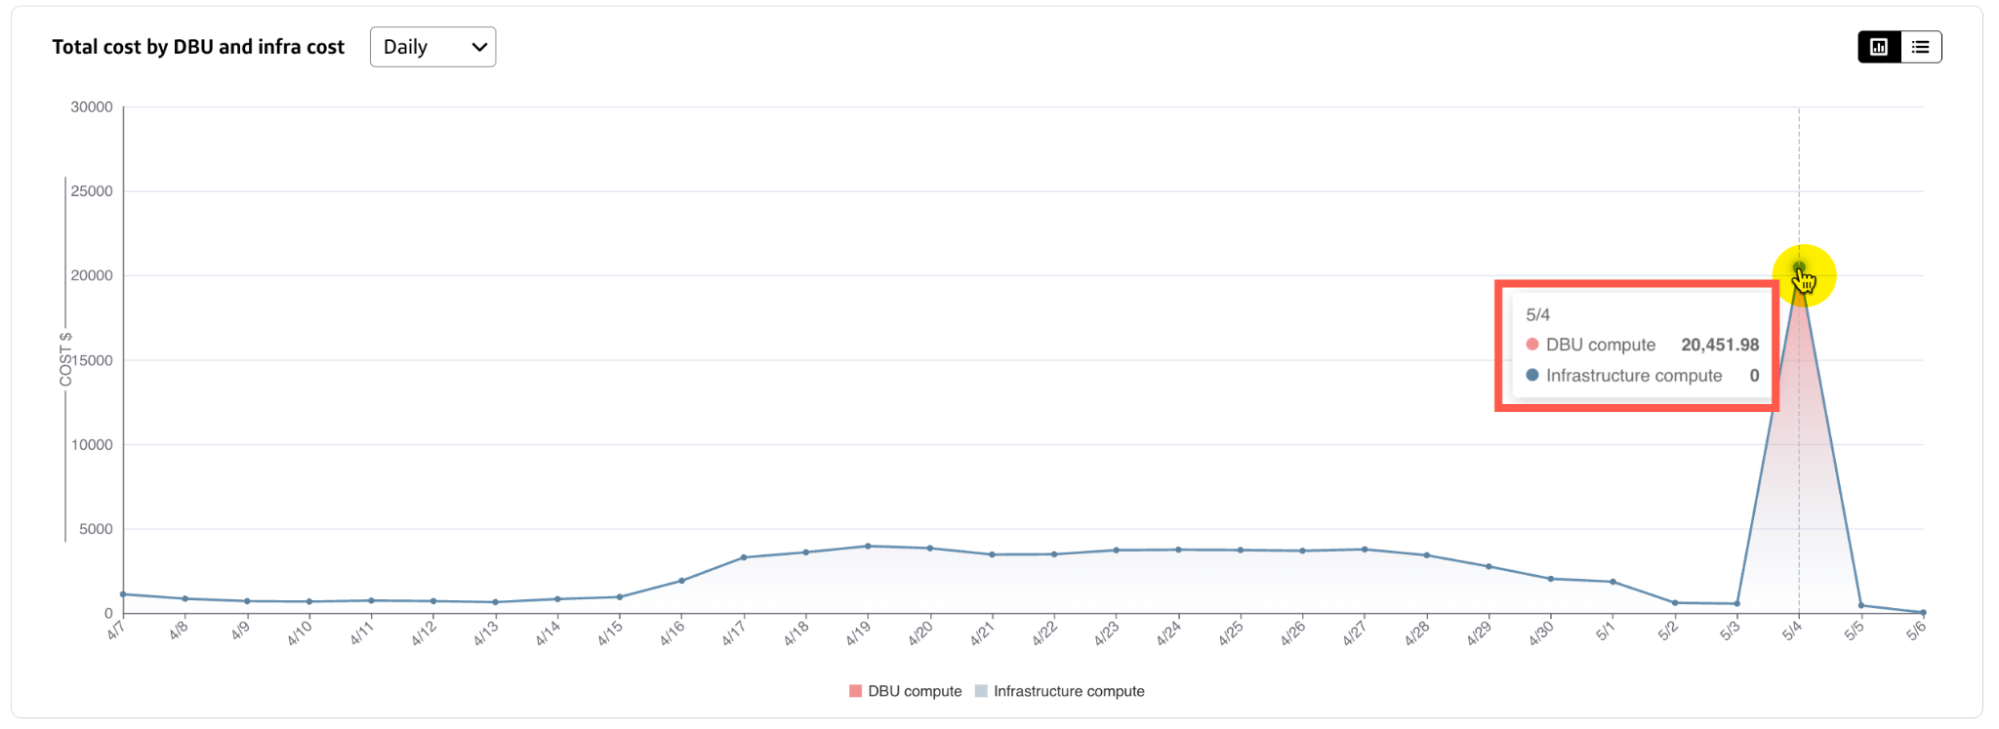
Table view
- Select a column heading to sort the table by Time increment, Total cost, DBU cost, DBU cost as % of total, Change in DBU cost, Infrastructure cost, Infrastructure cost as % of total, or Change in cost.
Cost by workspace
The Cost by workspace section on the Databricks tab displays the costs for your connected workspaces in a chart or table.
- You can select a different time increment from the Cost by workspace dropdown to change the view without affecting the other charts and tables on the Databricks tab.
- To switch between chart and table views, select the corresponding toggle in the top-right corner of the current view.
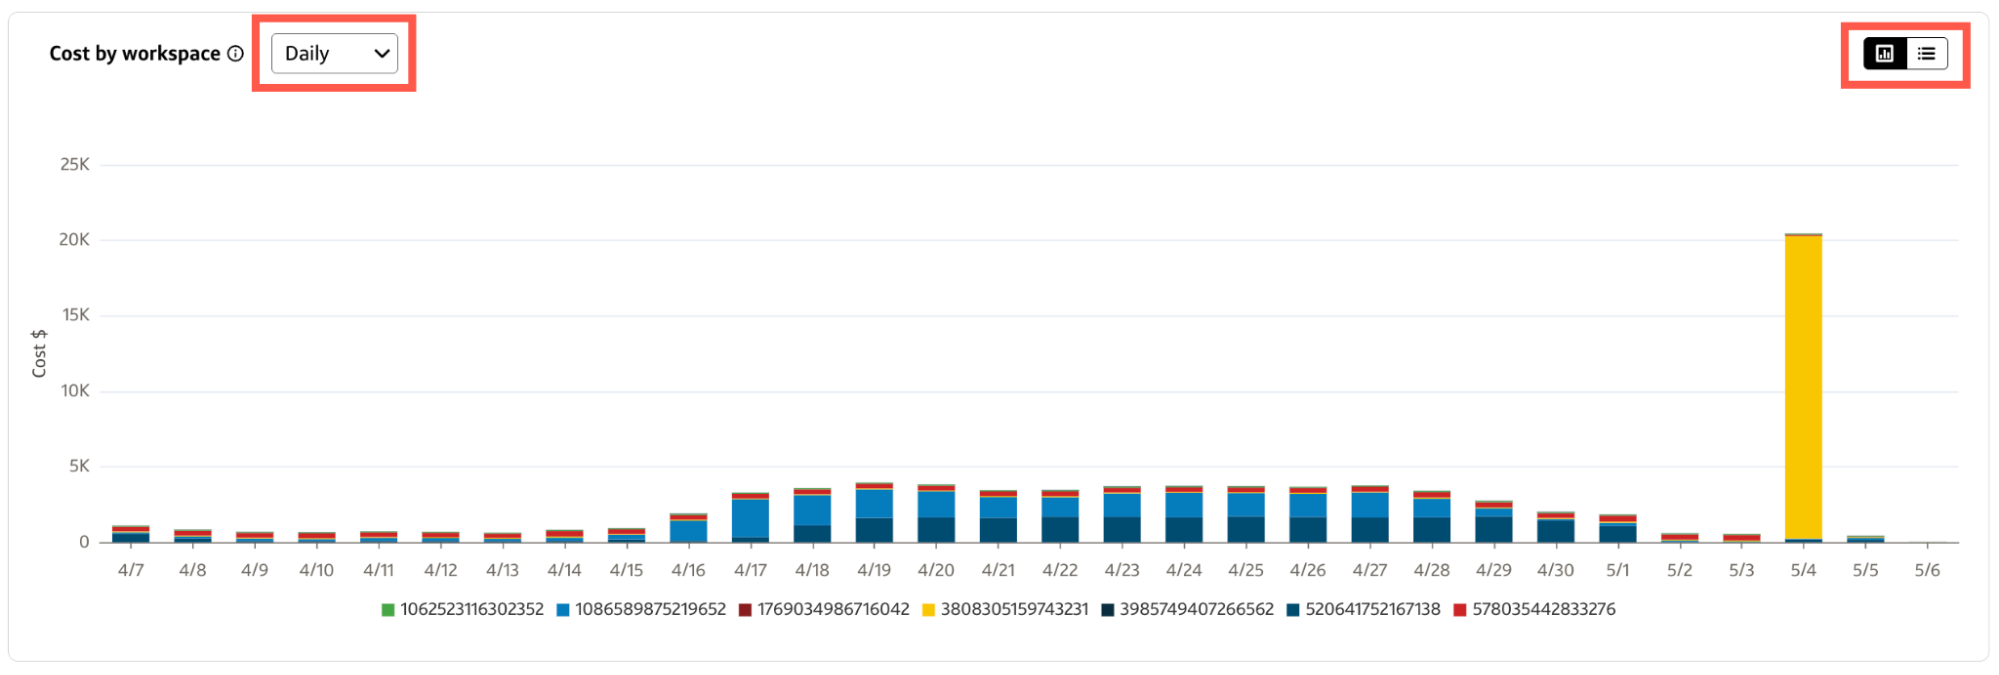
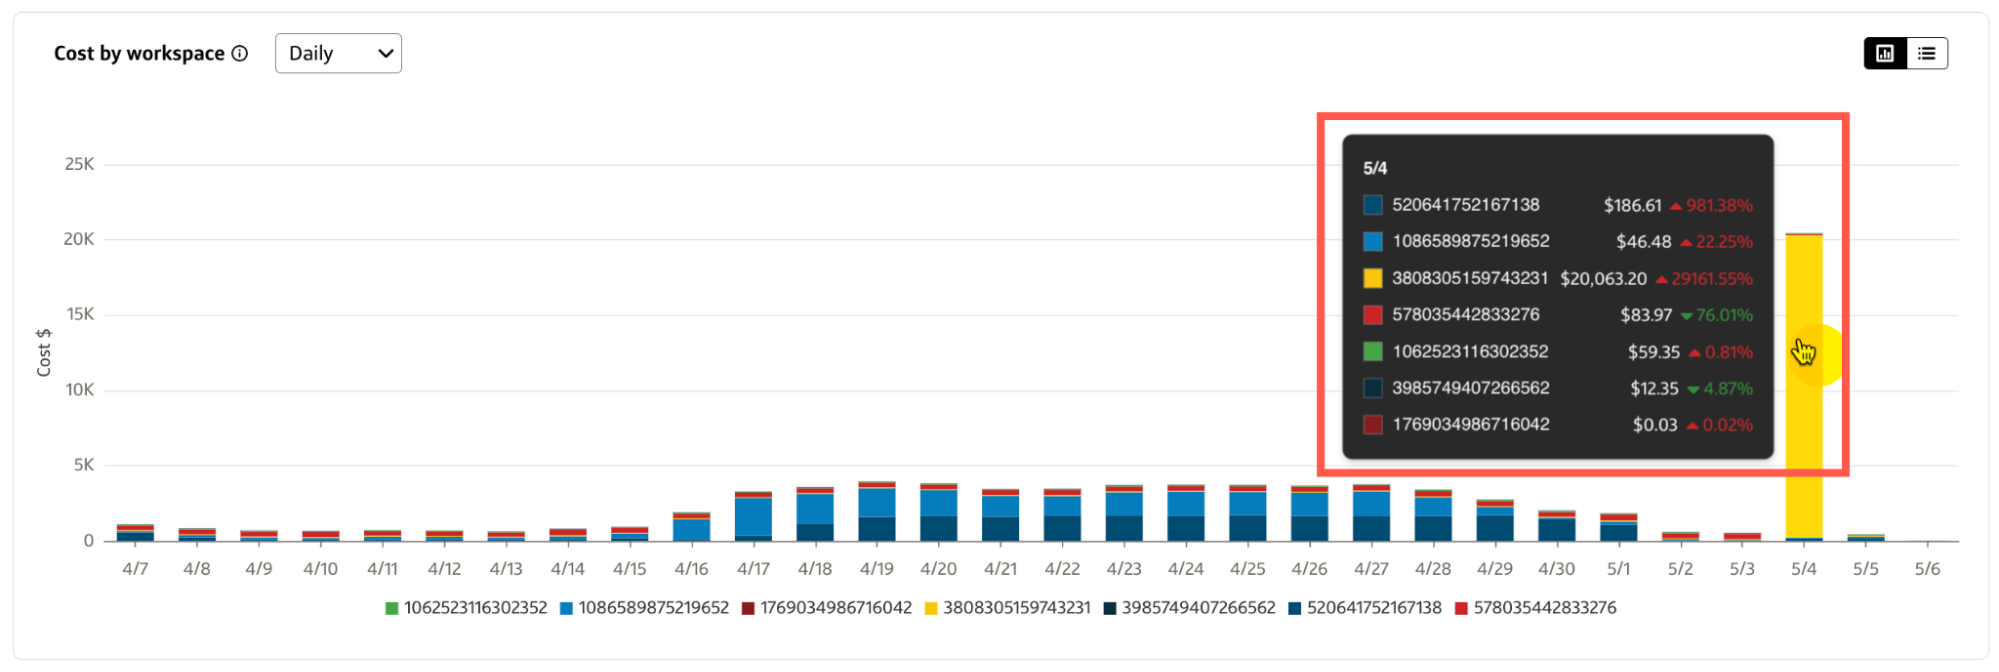
Chart view
- Hover over a bar in the chart to view a breakdown of your Databricks costs by workspace ID, total cost, change in cost, and percentage of total cost for a specific time increment in the selected date range.
- You can exclude or include specific accounts by selecting the Account name below the x-axis of the chart.
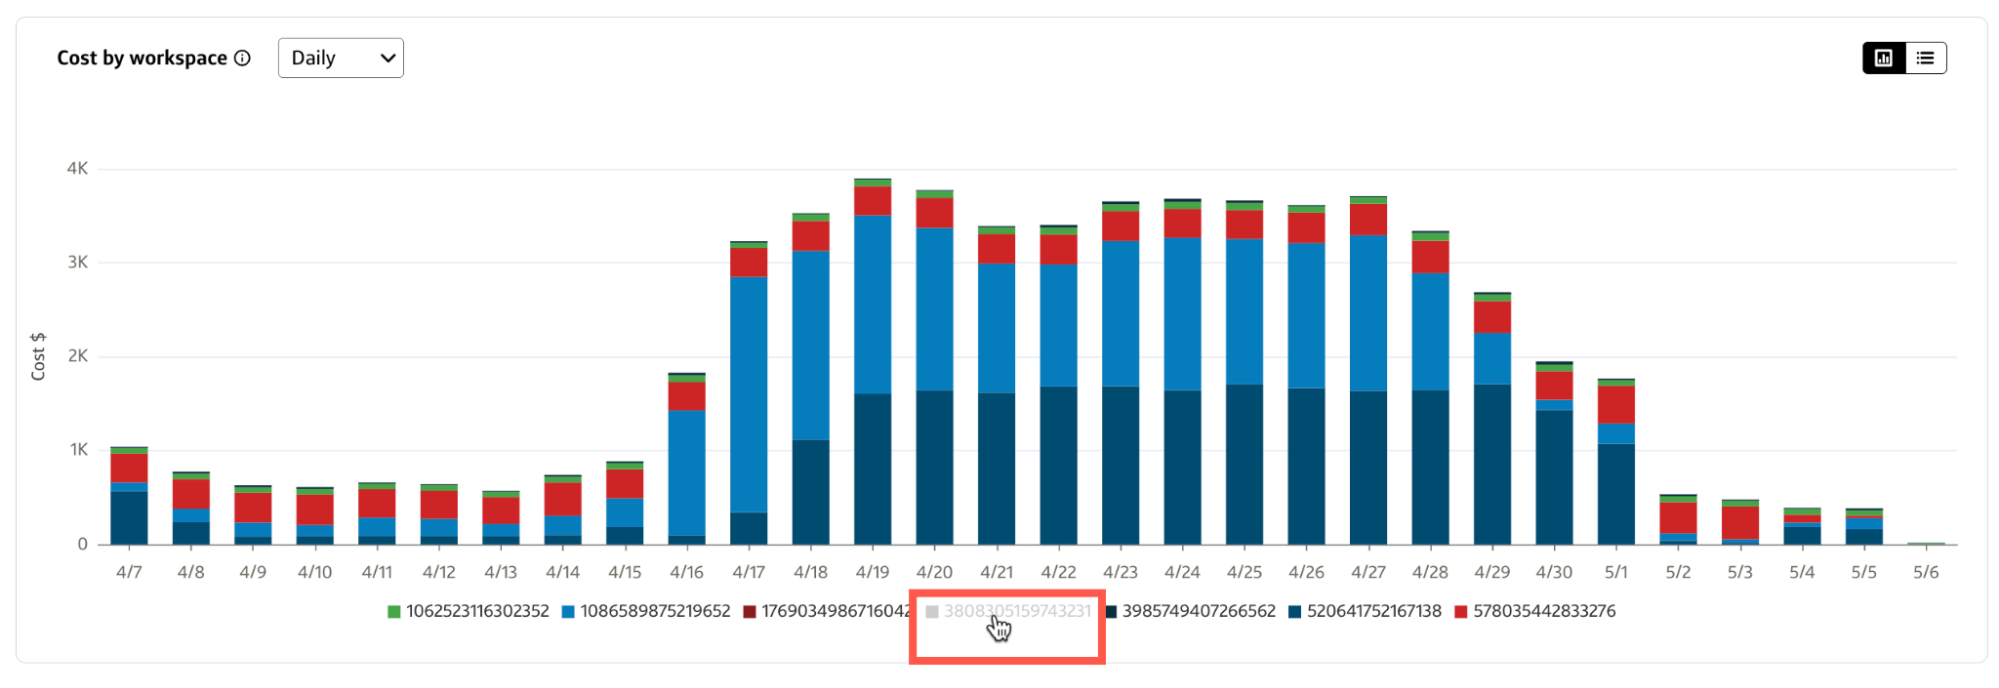
Table view
- Select a column heading to sort the table by Workspace name, Total cost, Change in cost, or % of total cost.
- Use the Search bar to filter the table by a specific field value, such as part of a Workspace name or a number in a cost.
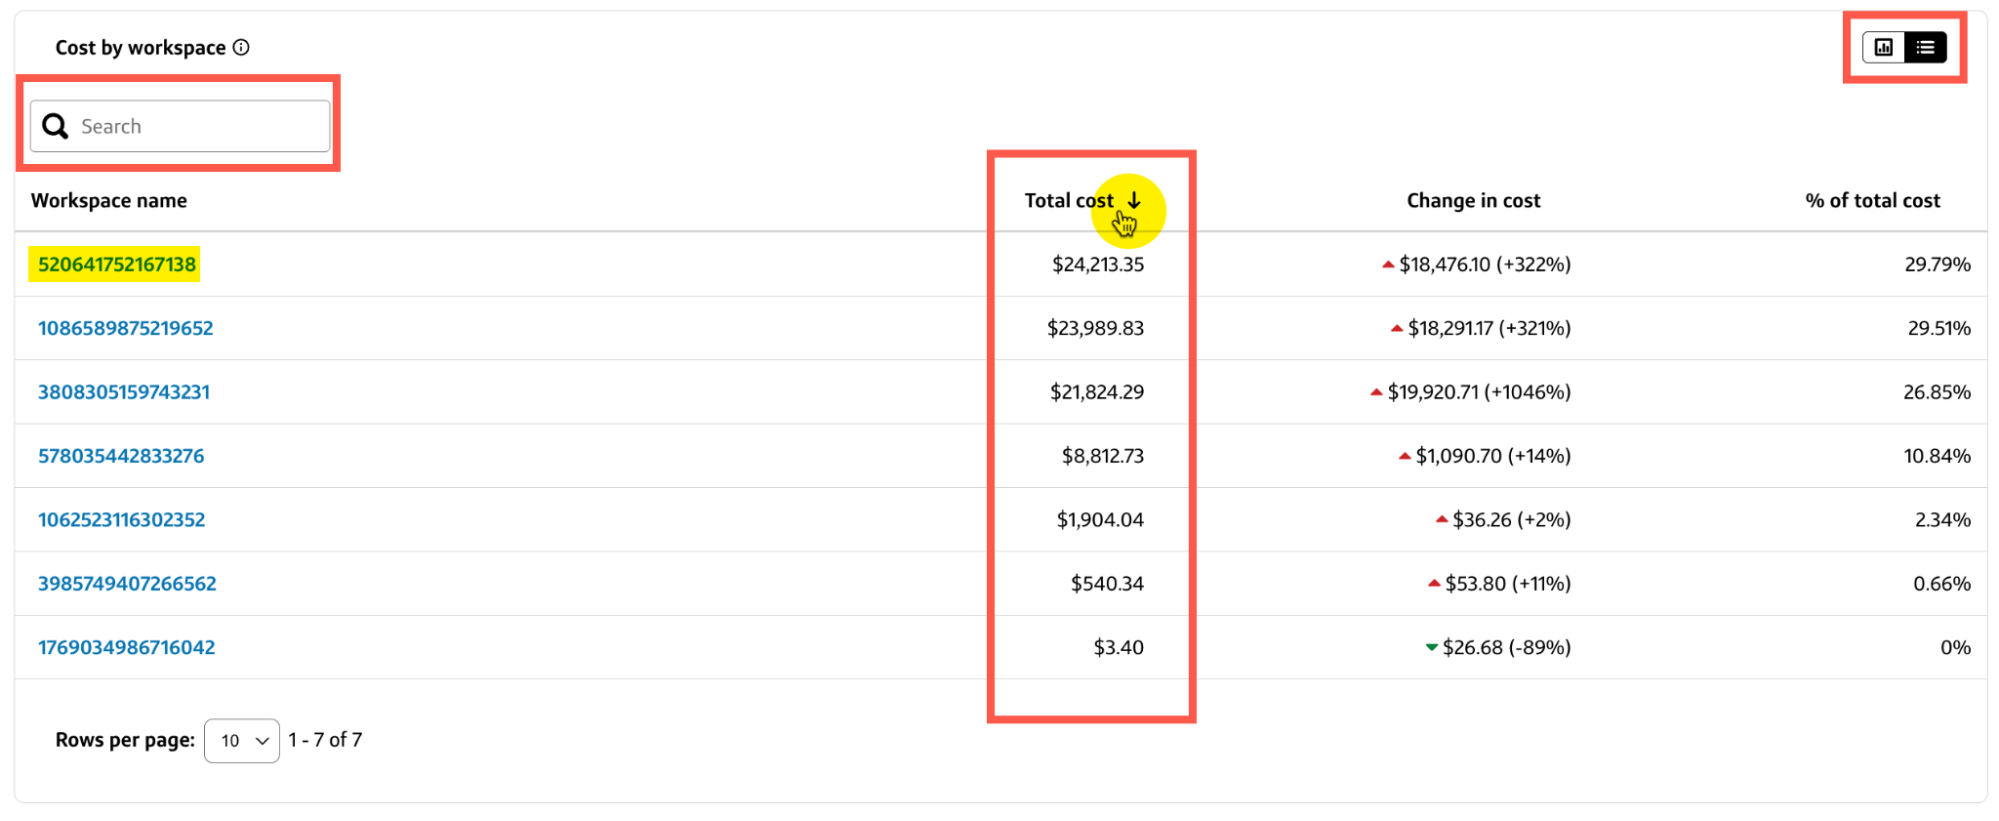
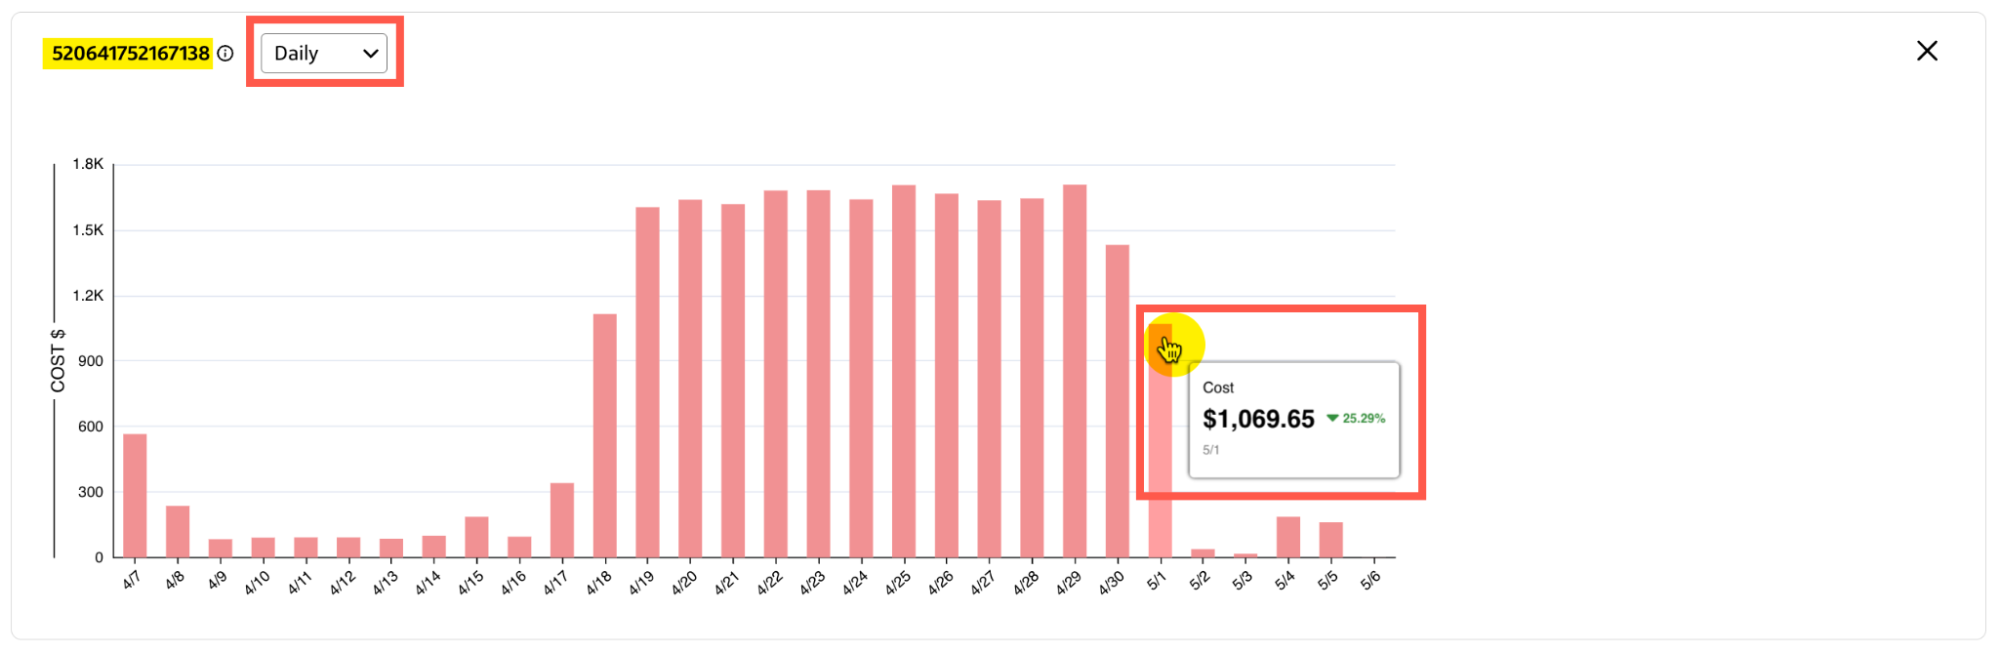
- To display an overlay chart for the incremental costs associated with a specific workspace, select the Workspace name from the table column.
Cost by billing origin product
The Cost by billing origin product section on the Databricks tab breaks down your costs by Databricks billing origin product.
- To switch between chart and table views, select the corresponding toggle in the top-right corner of the current view.
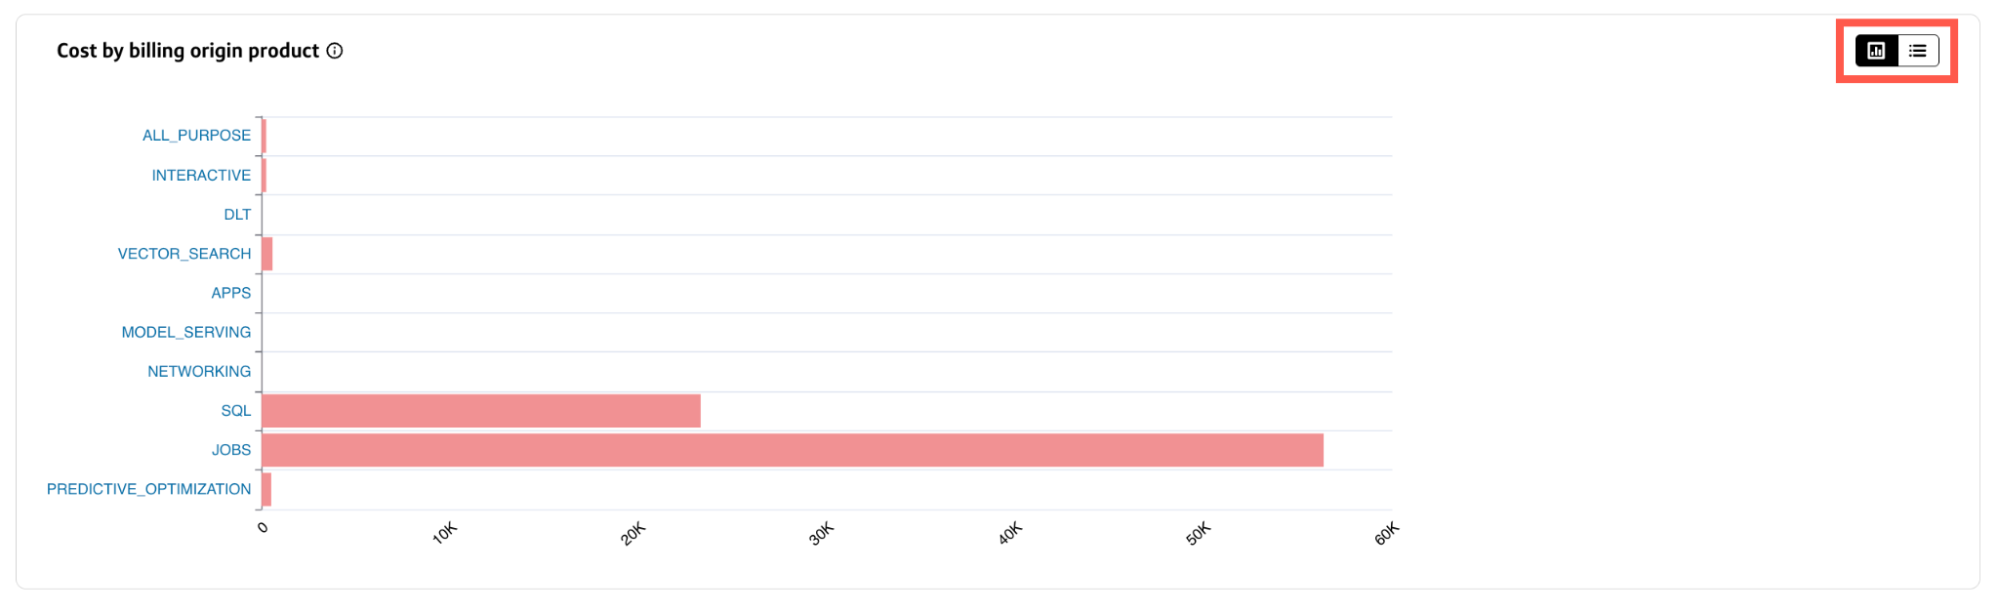
Chart view
- Hover over a bar in the chart to view the total cost for that billing origin product.
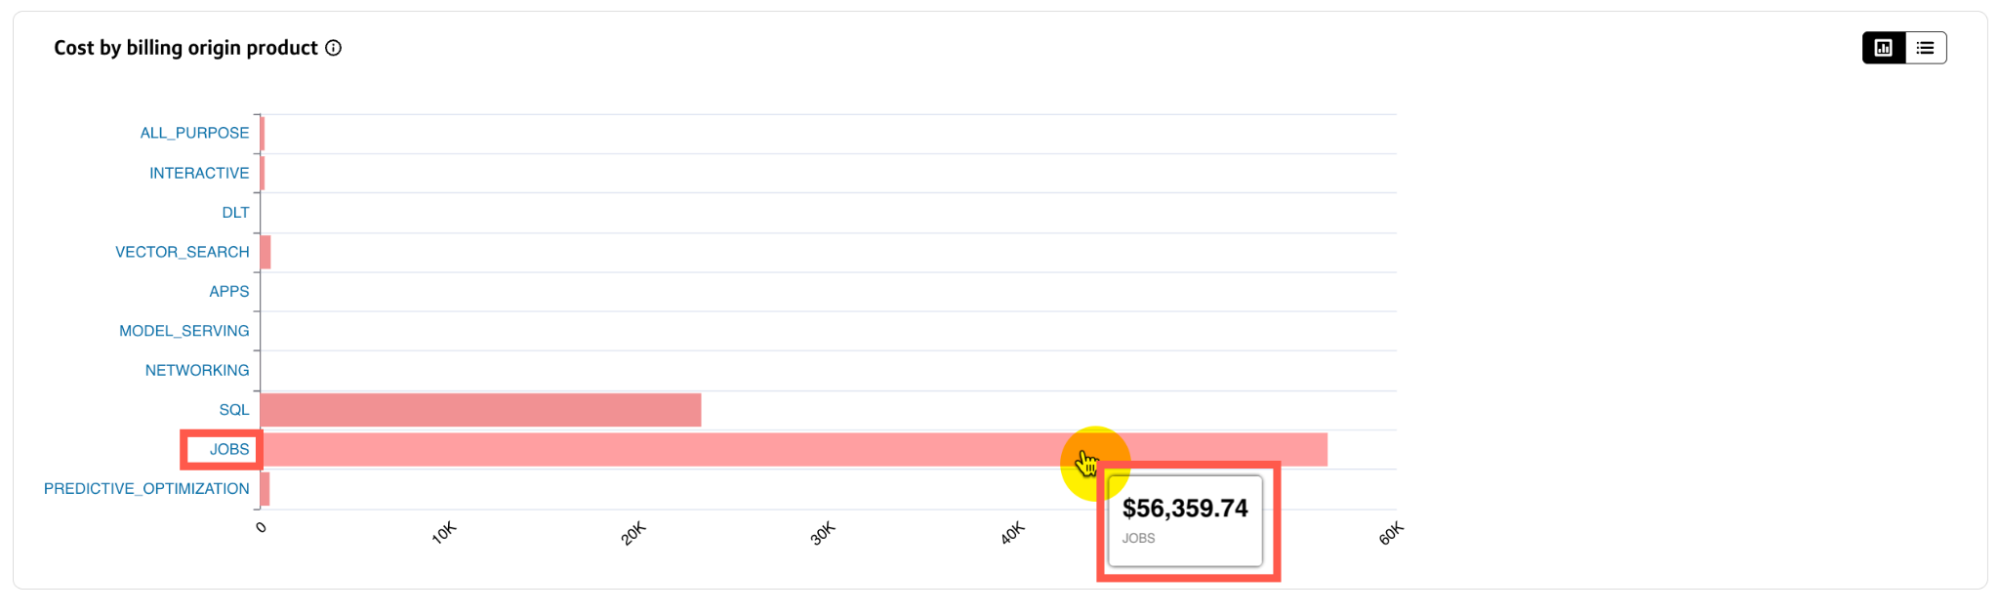
To view incremental costs for a specific billing origin product:
- Select the billing origin product from the y-axis of the chart.
- In the overlay chart that appears, hover over a bar to view the total cost and change in cost for a specific time increment.
- You can select a different time increment from the dropdown to change the view without affecting the other charts and tables on the Databricks tab.
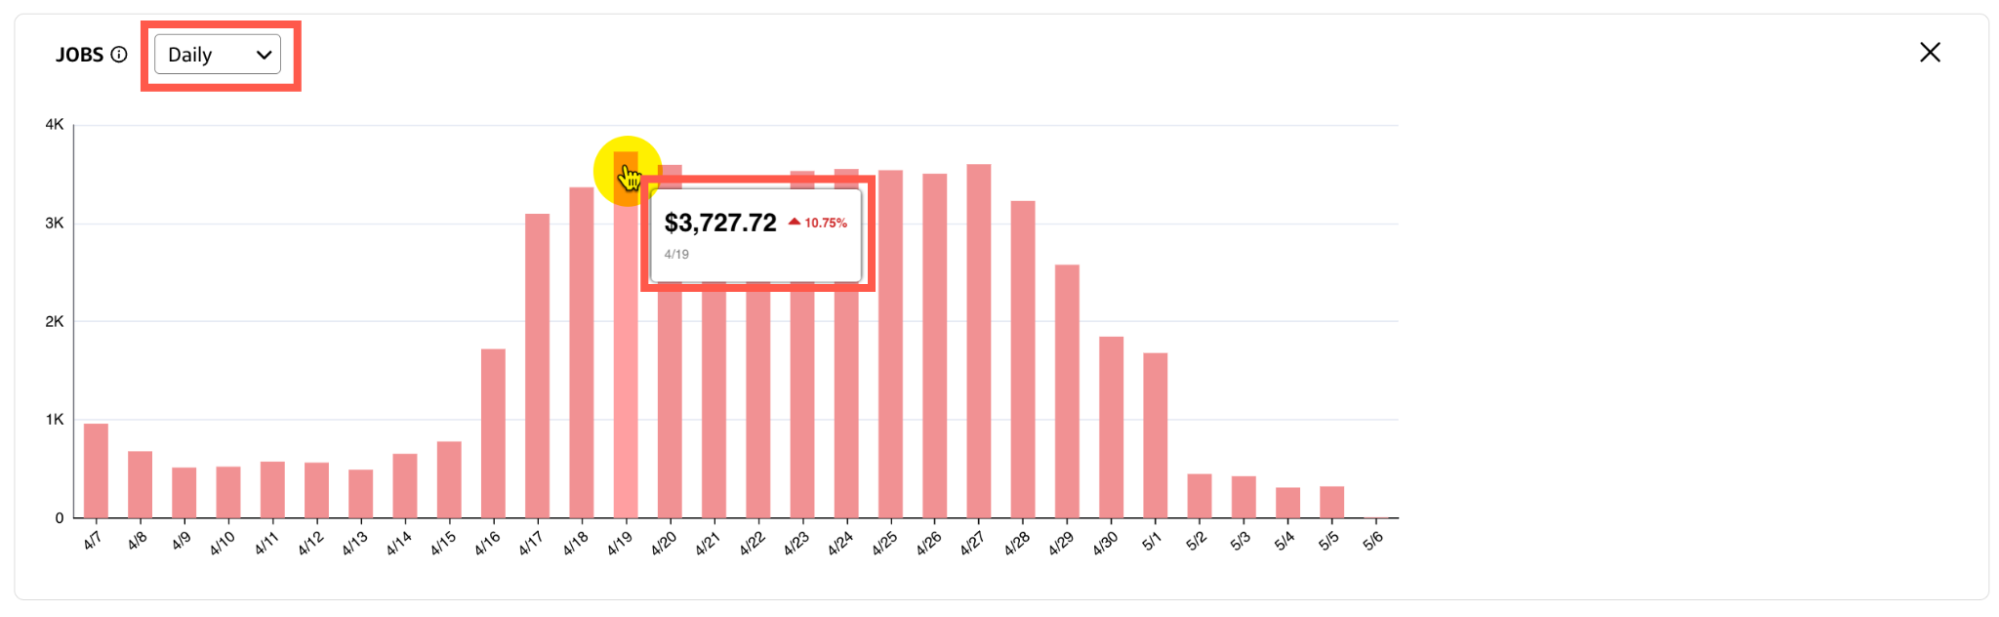
Table view
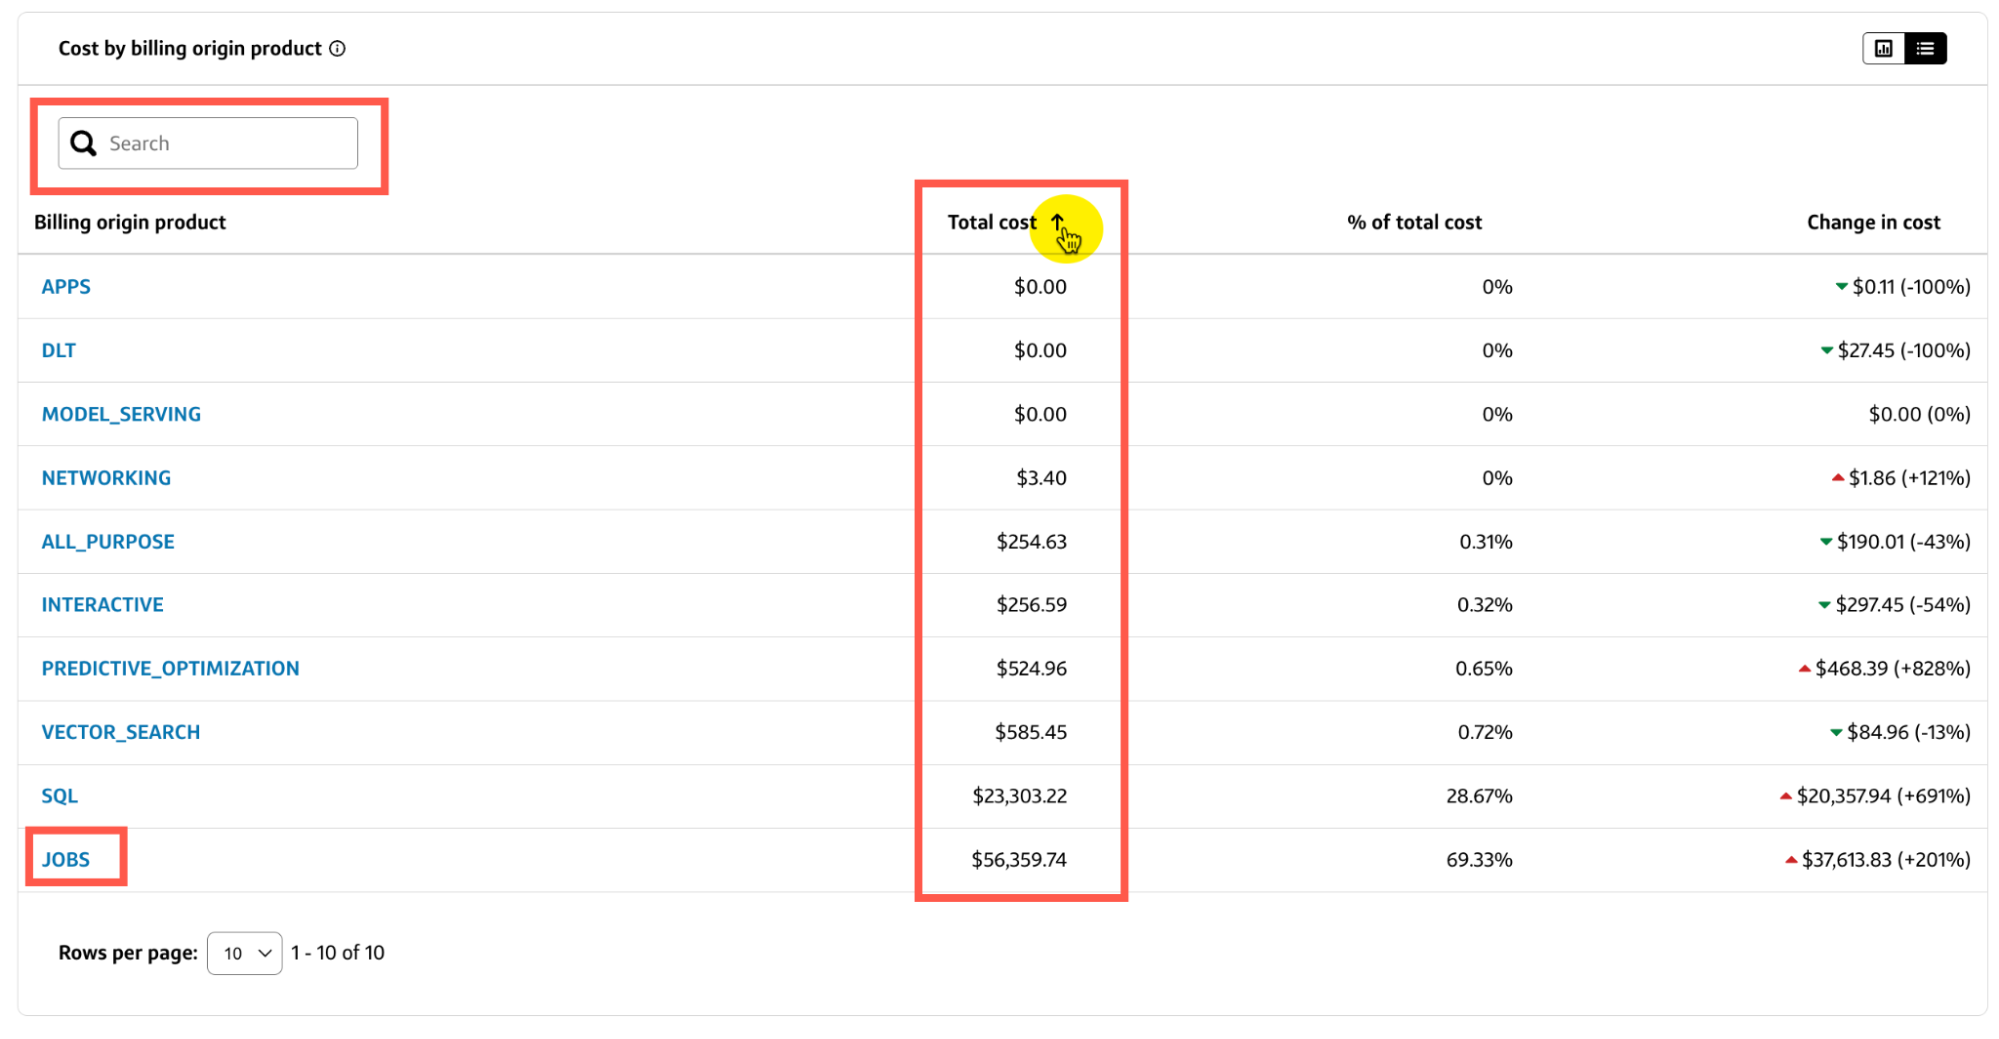
The Cost by billing origin product table lists the Total cost, % of total cost, and Change in cost for each Billing origin product.
- Select a column heading to sort the table by that field.
- Use the Search bar to filter the table by a specific field value, such as part of a Billing origin product name or a number in a cost.
- Select a Billing origin product name from the table column to view incremental costs associated with the specific product.