Multi-platform cost trends
Overview
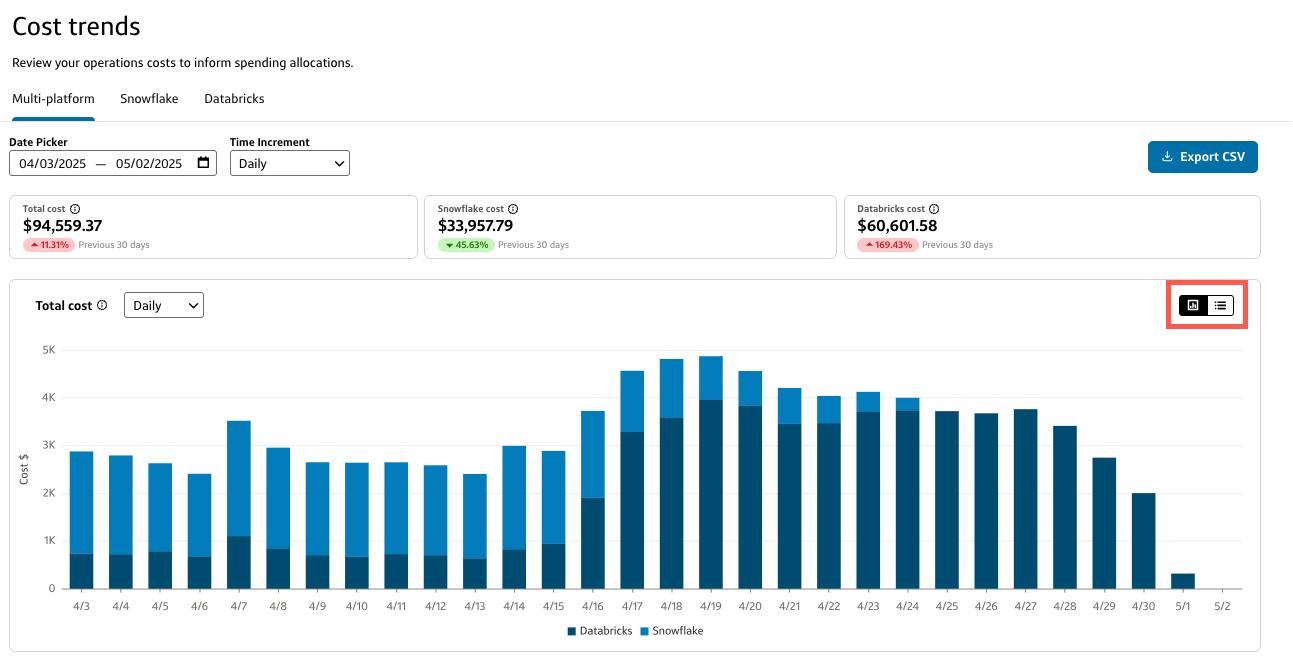
The Multi-platform tab aggregates your Snowflake and Databricks cost trends in a chart or table.
- To switch between chart and table views, select the corresponding toggle in the top-right corner of the current view.
- To download the data as a CSV report, select Export CSV and select the data you want to include in the report.
You can customize the data in both the chart and table by:
- Date picker: Select a custom data range or use one of the preset date ranges.
- Time increment: Select a time increment from the dropdown. Depending on the date range you selected, your time increment can be Daily, Weekly, or Monthly.
The costs displayed on the Multi-platform tab include:
- Total cost: The sum of your Snowflake and Databricks costs.
- Snowflake cost: Includes all compute costs and some data transfer costs associated with Snowflake; does not include storage costs.
- Databricks cost: Includes DBU (Databricks Unit) and infrastructure costs.
Multi-platform chart
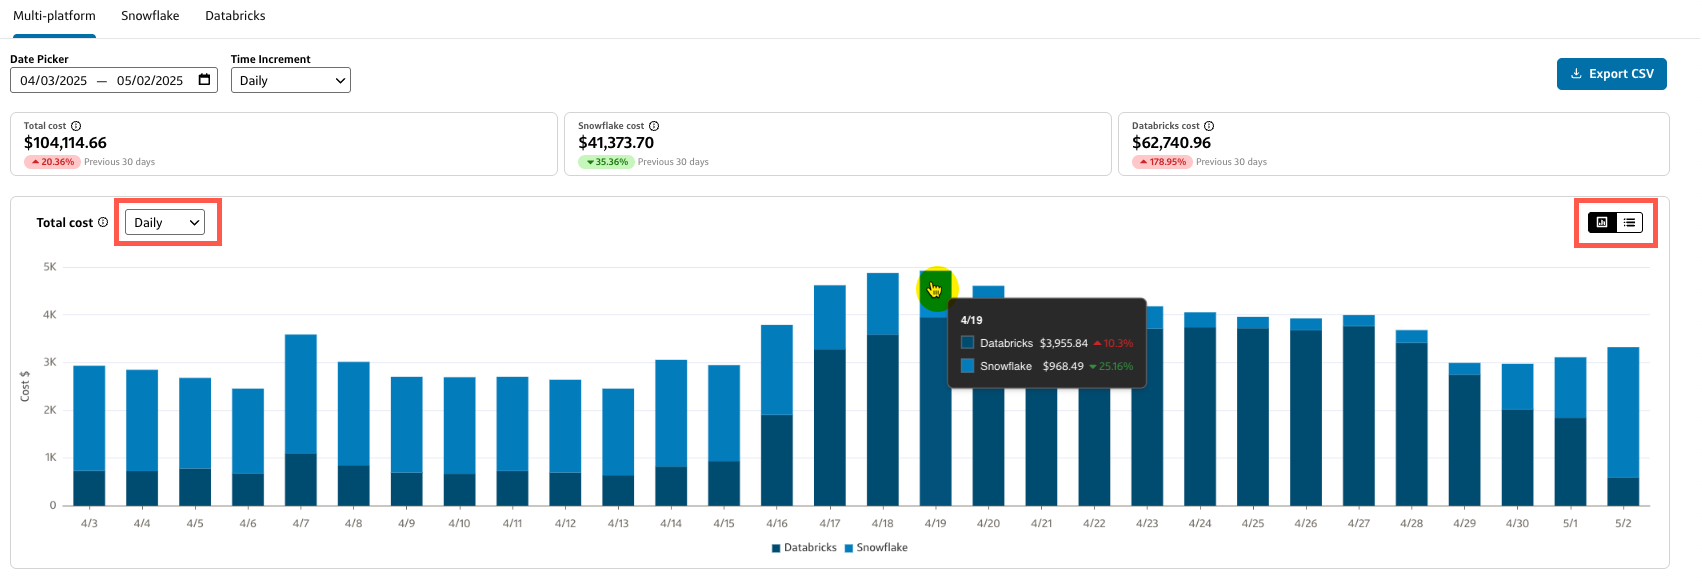
The Multi-platform chart provides a graphical breakdown of the total costs for your selected date range and time increment by platform type (product).
- Hover over a specific bar segment to view the total costs associated with each platform for a specific time increment.
- You can select a different time increment from the Total cost dropdown to customize the chart further.
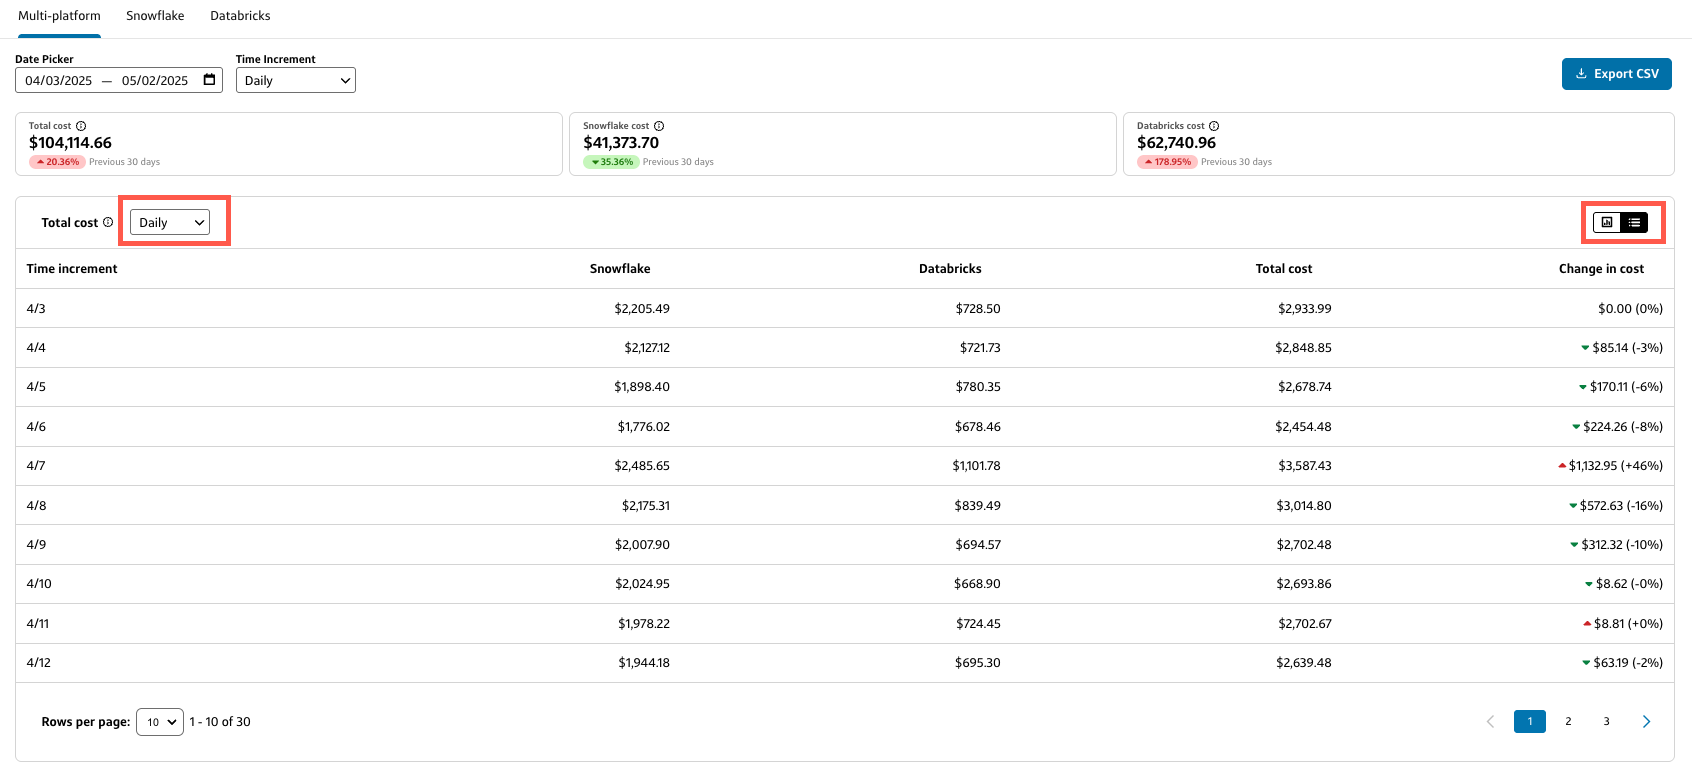
Multi-platform table
The Multi-platform table lists your Snowflake costs, Databricks costs, Total cost, and Change in cost for each Time increment in the selected date range.
- Select a column heading to sort the table by that field.
- You can select a different time increment from the Total cost dropdown to customize the table further.