Snowflake cost trends
Overview
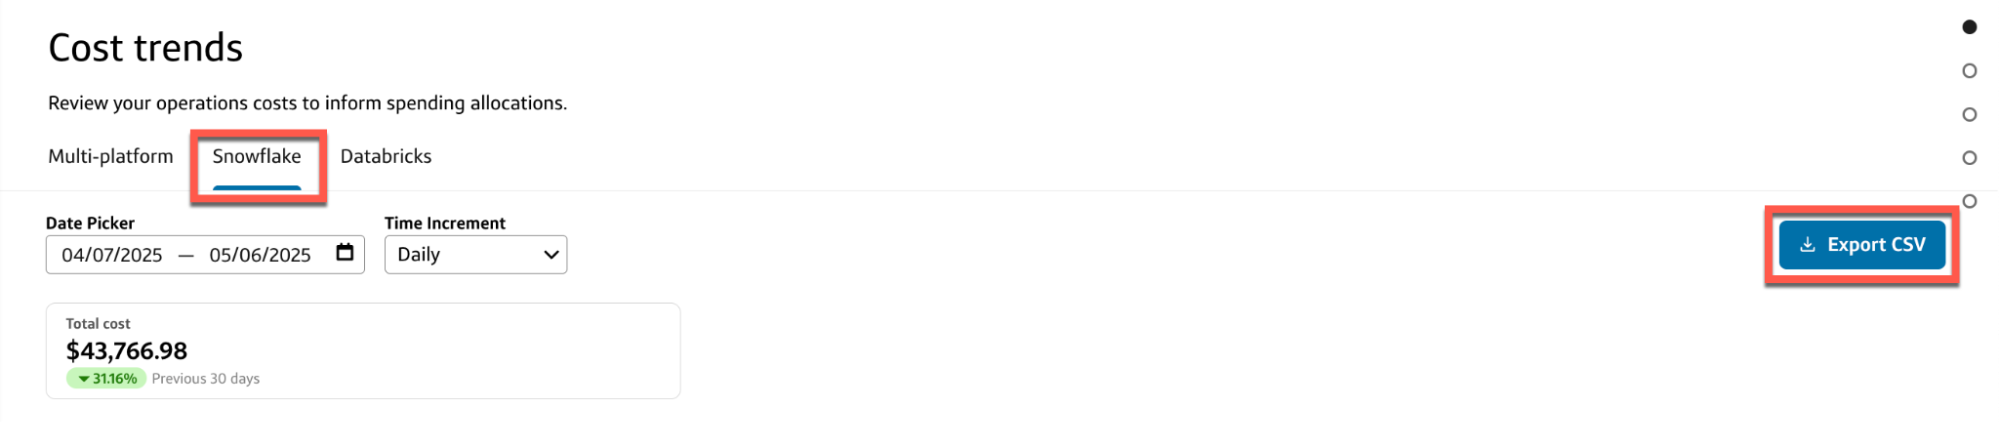
The Snowflake tab displays your Total cost associated with Snowflake (excluding storage costs) for the selected date range and provides additional charts and tables to break down the data.
- To download the data as a CSV report, select Export CSV and select the data you want to include in the report.
You can customize the data in the charts and tables by:
- Date picker: Select a custom data range or use one of the preset date ranges.
- Time increment: Select a time increment from the dropdown. Depending on the date range you selected, your time increment can be Daily, Weekly, or Monthly.
Total cost
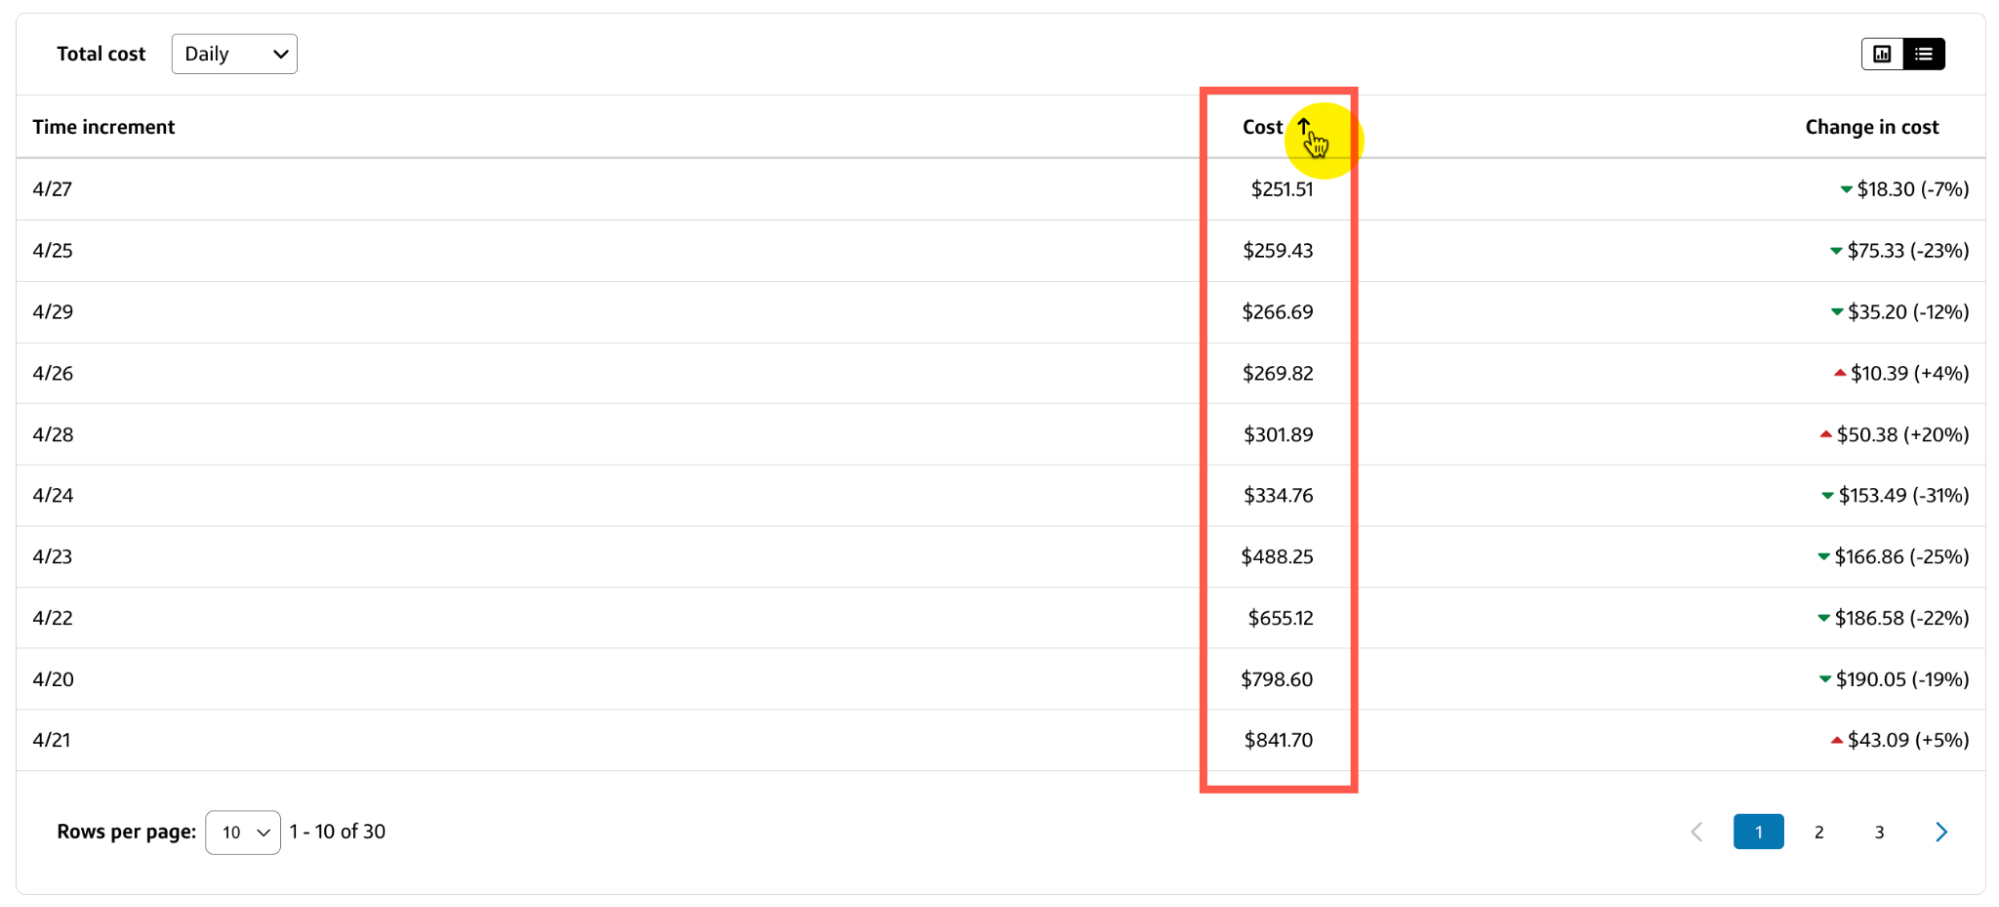
The Total cost chart or table on the Snowflake tab displays the Cost and Change in cost for each Time increment in the selected date range.
- You can select a different time increment from the Total cost dropdown to change the view without affecting the other charts and tables on the Snowflake tab.
- To switch between chart and table views, select the corresponding toggle in the top-right corner of the current view.
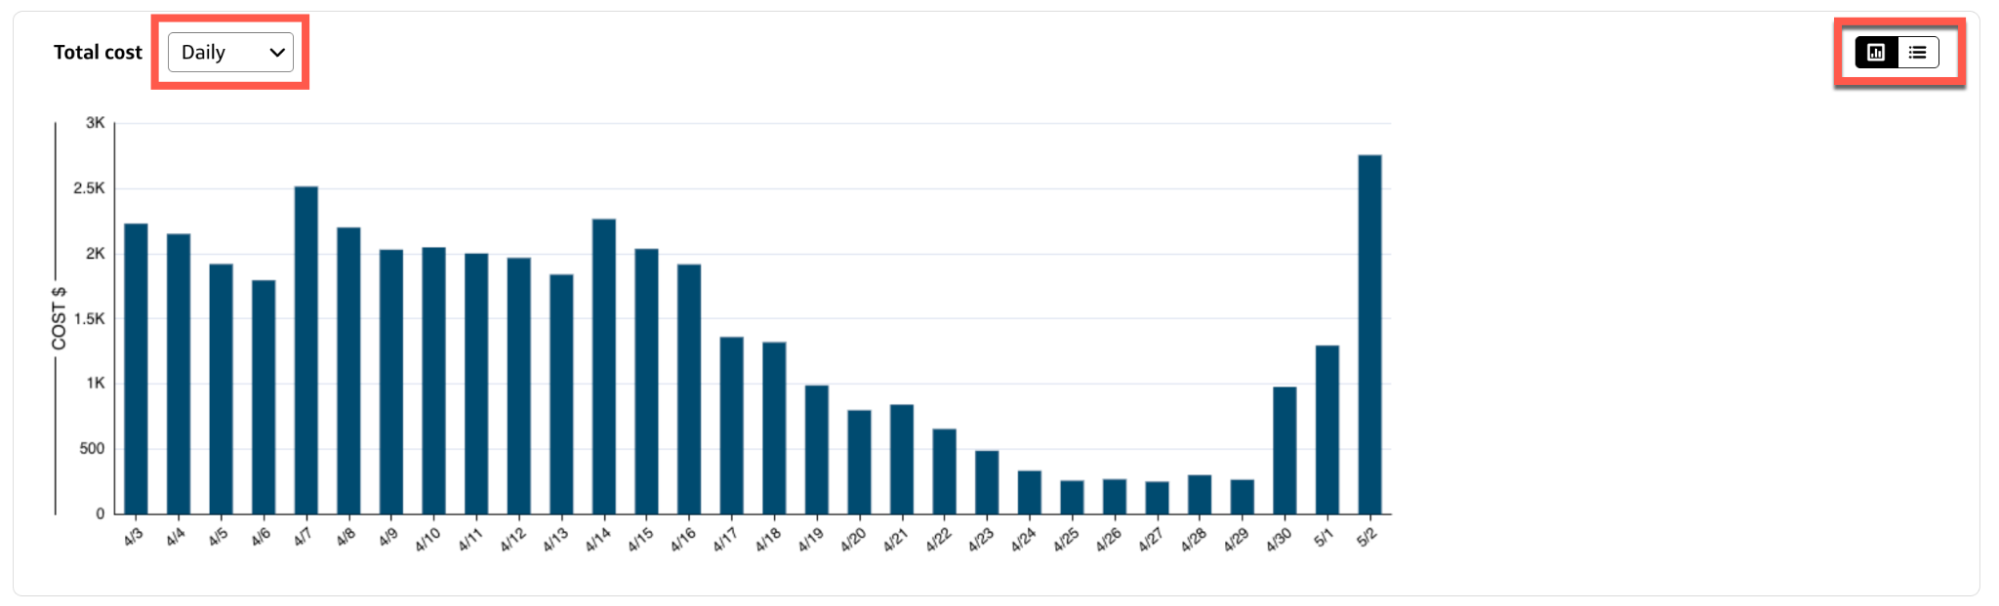
Chart view
- Hover over a bar in the chart to view your Snowflake costs and change in cost for a specific time increment.
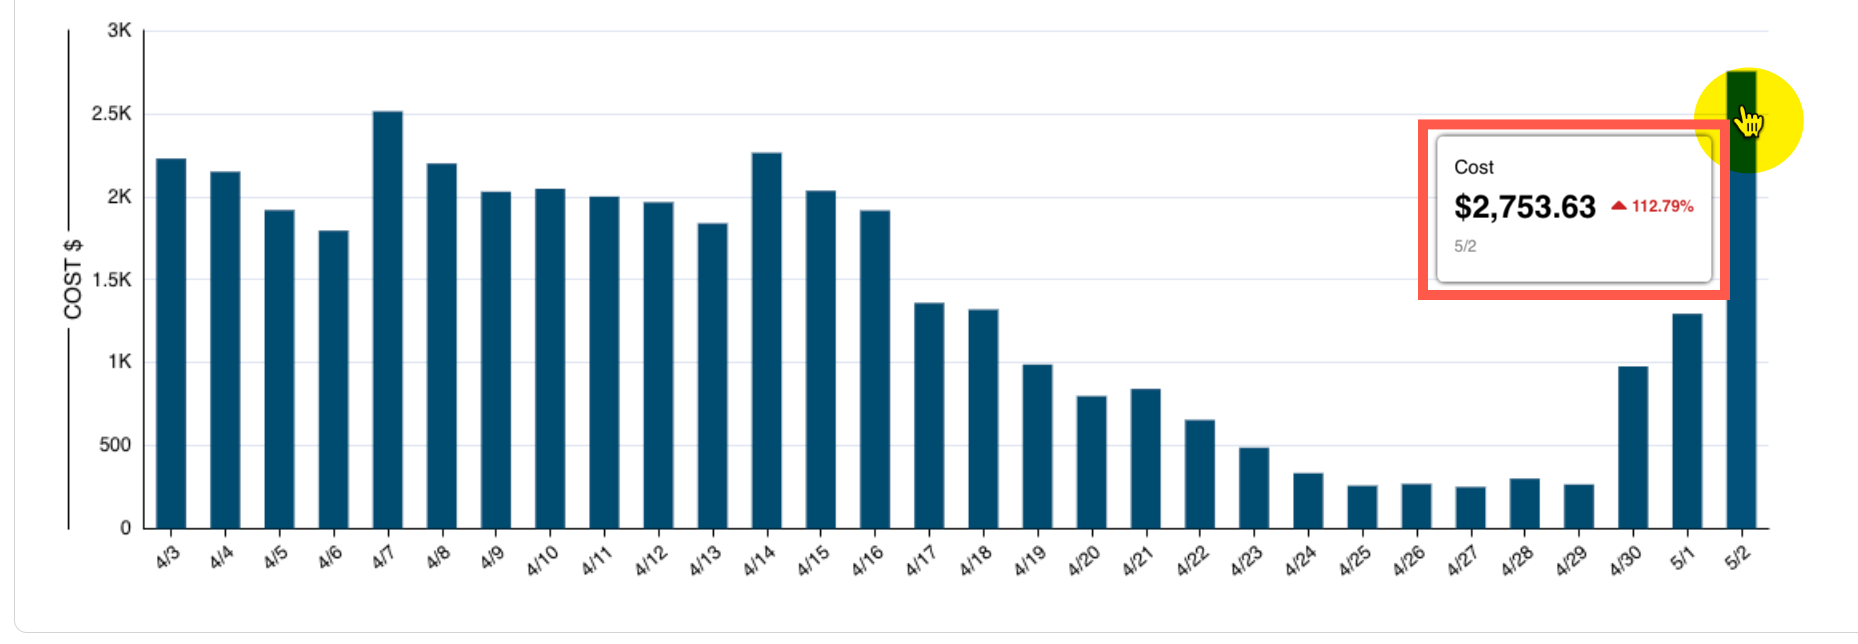
Table view
- Select a column heading to sort the table by Time increment, Cost, or Change in cost.
Cost by account
The Cost by account chart or table on the Snowflake tab displays the Total cost, Change in cost, % of total cost for each Account name in the selected date range.
- You can select a different time increment from the Cost by account dropdown to change the view without affecting the other charts and tables on the Snowflake tab.
- To switch between chart and table views, select the corresponding toggle in the top-right corner of the current view.
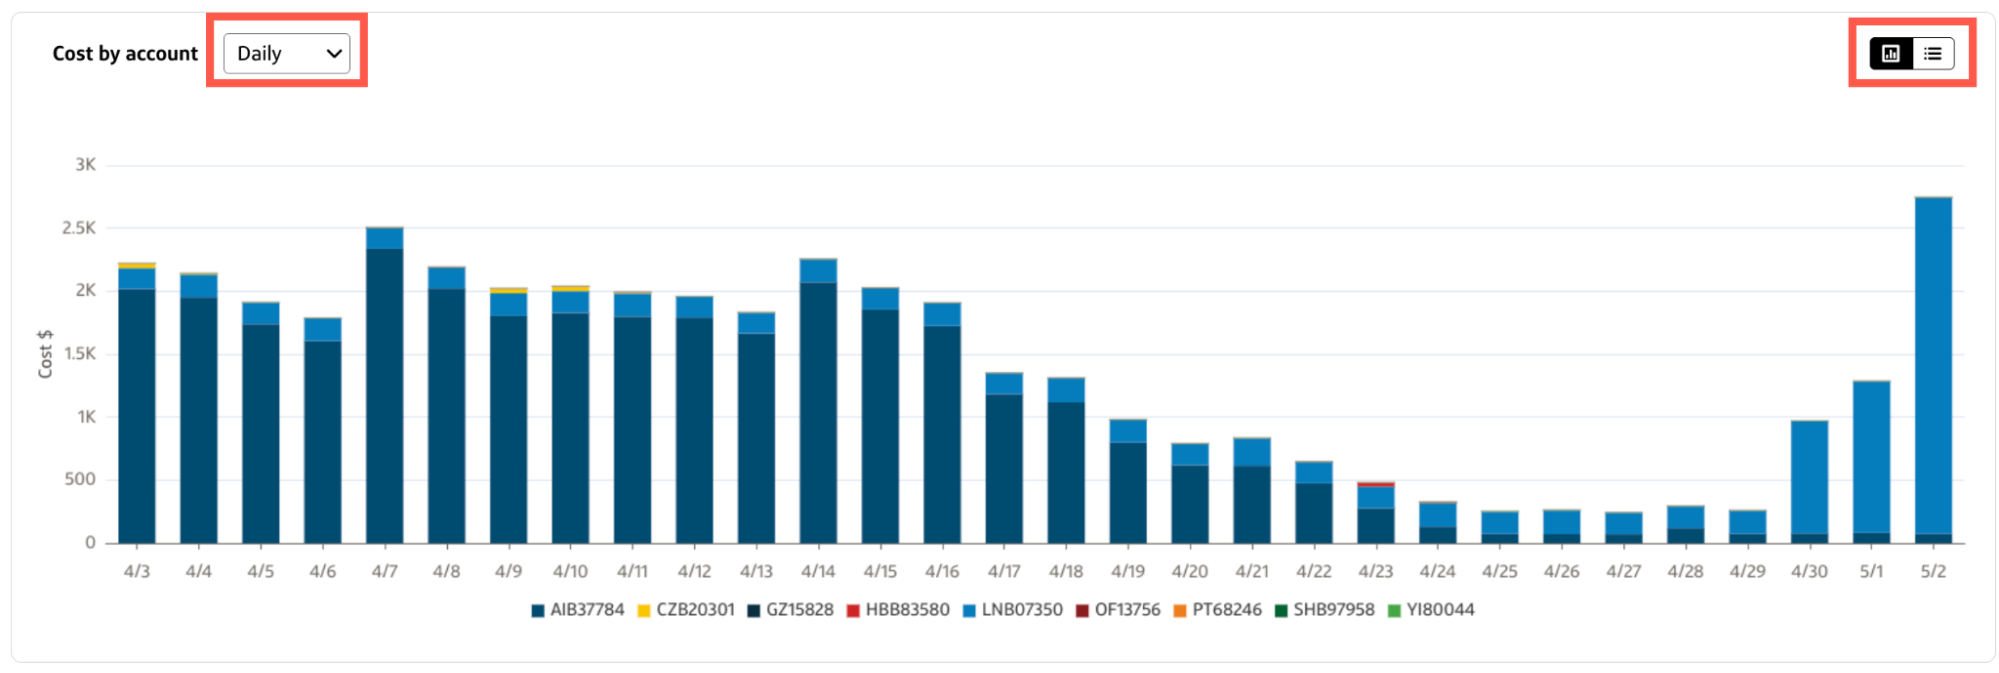
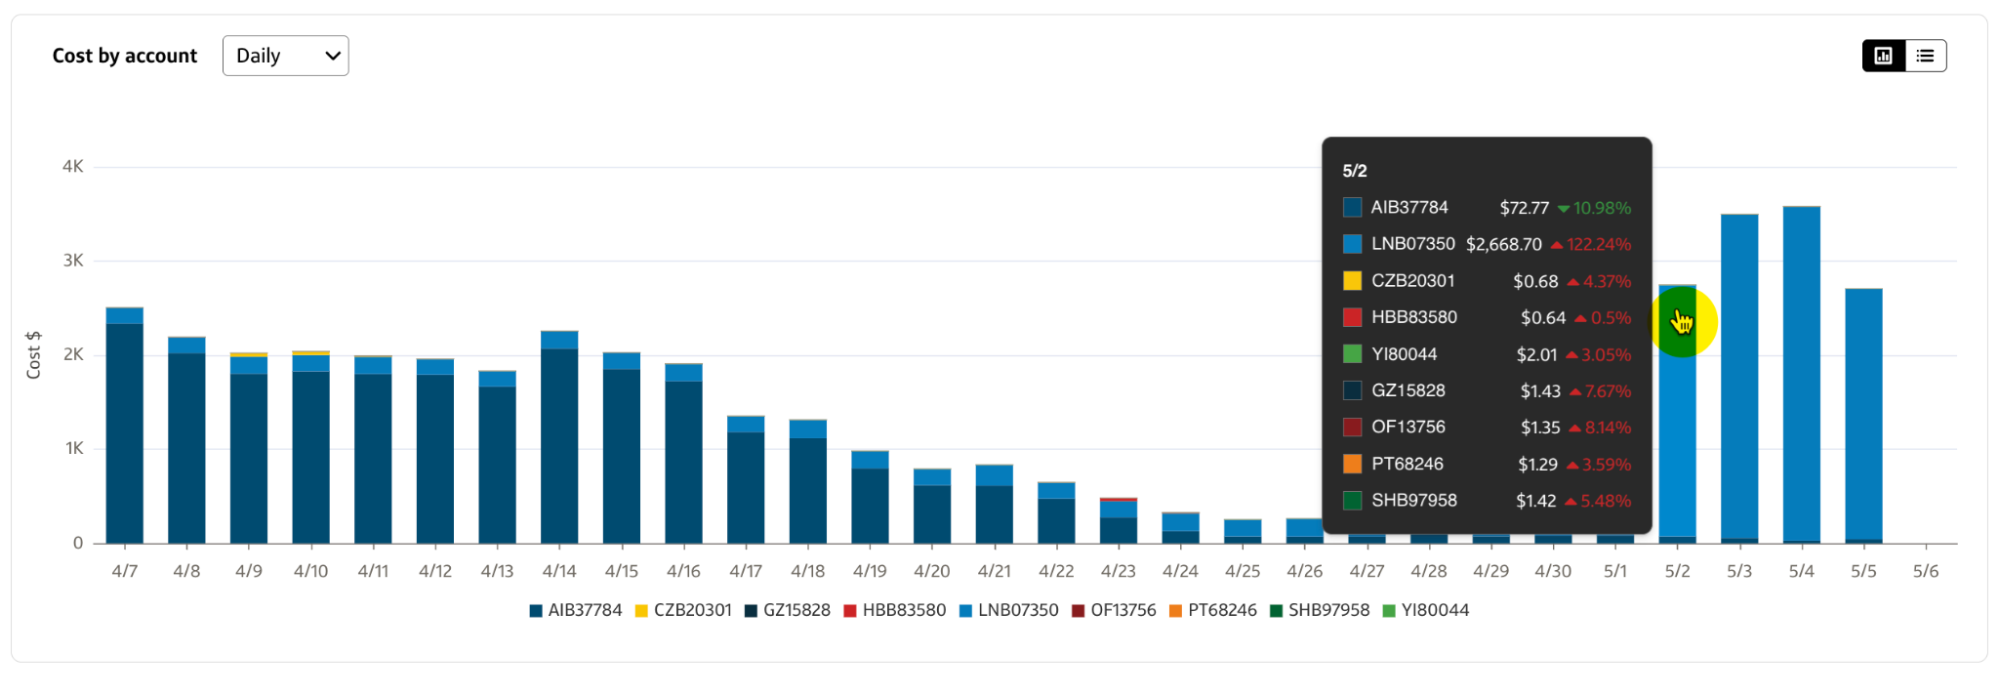
Chart view
- Hover over a bar in the chart to view a breakdown of your Snowflake costs by account name, total cost (for the account name), change in cost (from the previous day), and the total cost as a percentage of total cost (for all Snowflake accounts) for a specific time increment.
- You can exclude or include specific accounts by selecting the Account name below the x-axis of the chart.
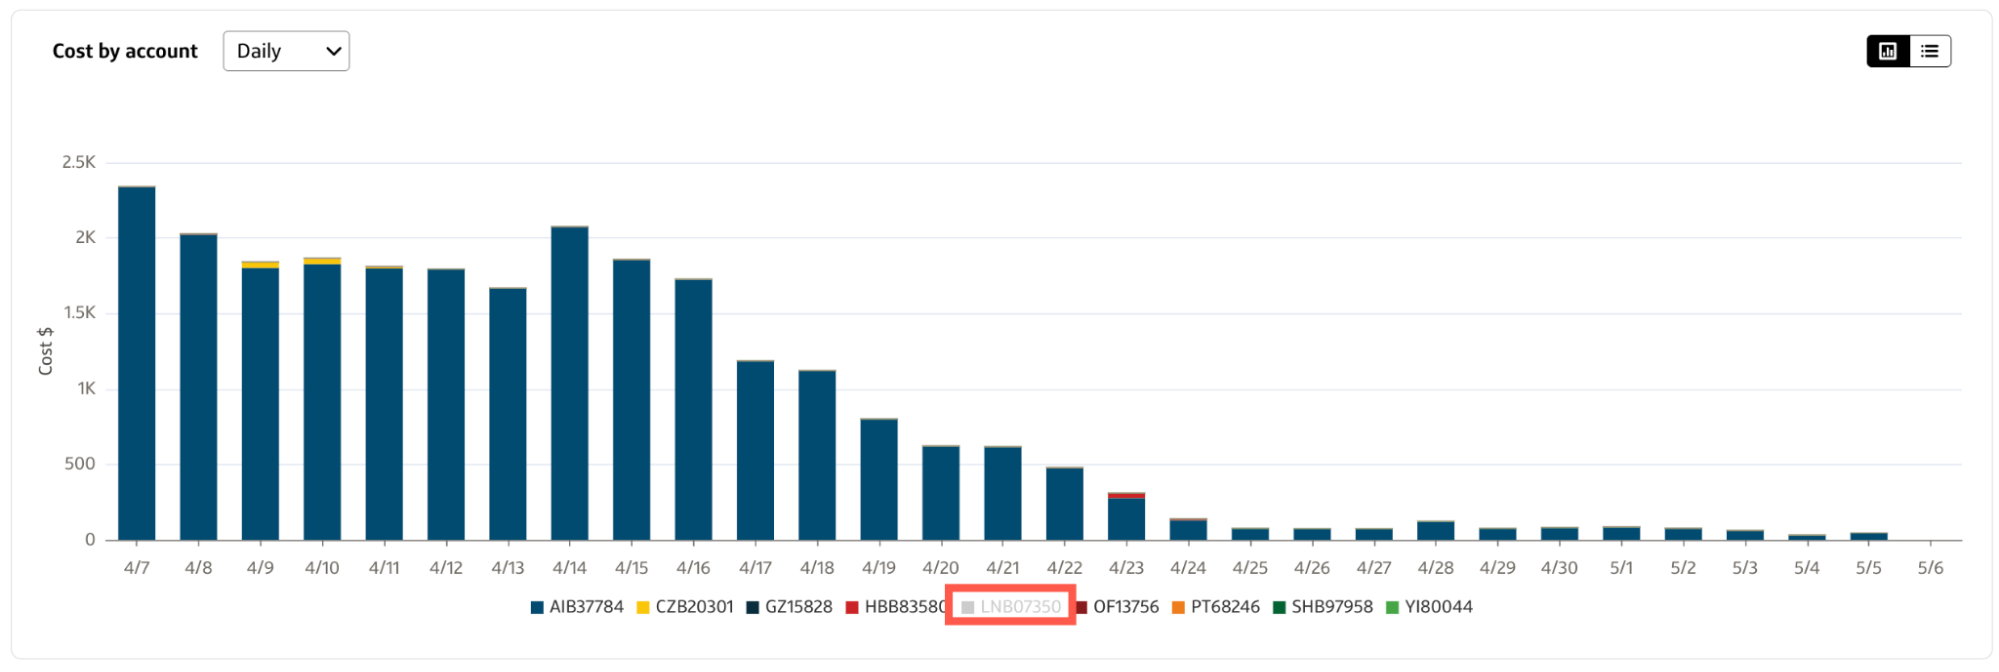
Table view
- Select a column heading to sort the table by Account name, Total cost, Change in cost, or % of total cost.
- Use the Search bar to filter the table by a specific field value, such as part of an Account name or a number in a cost.
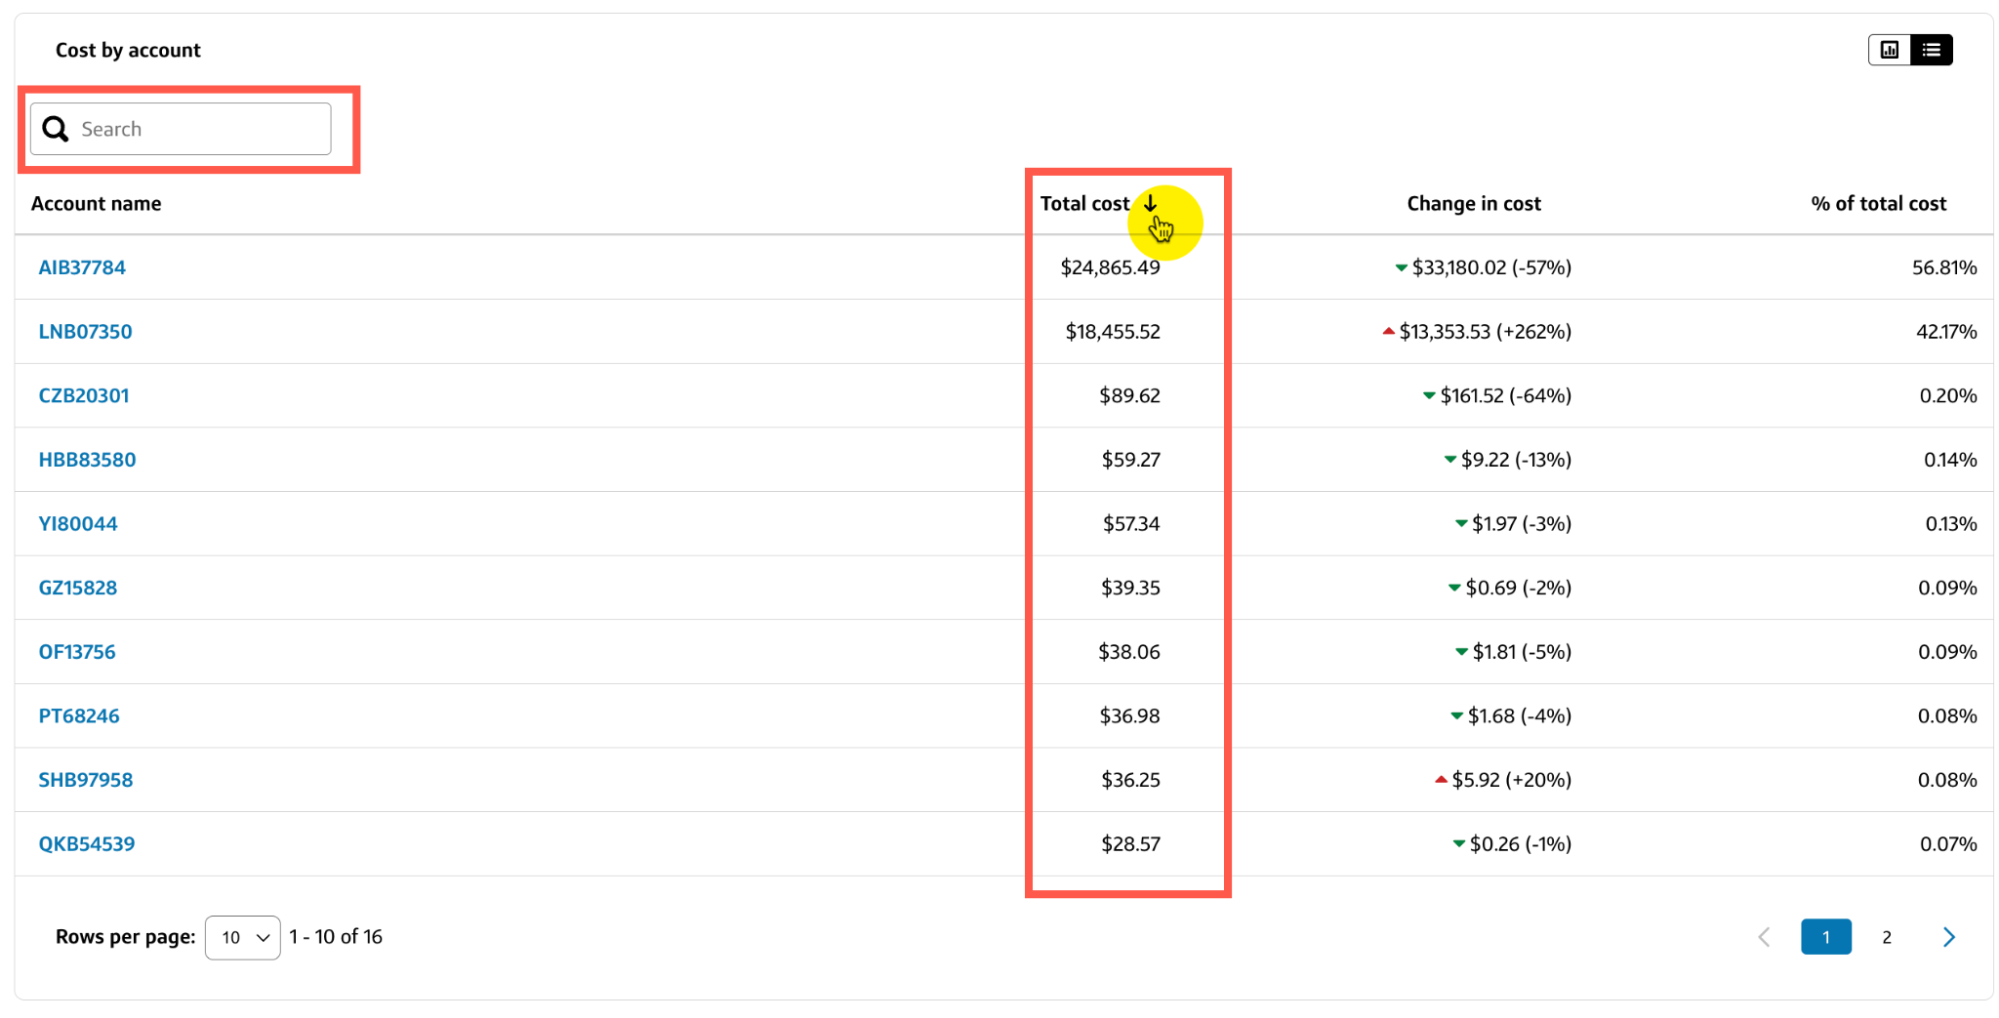
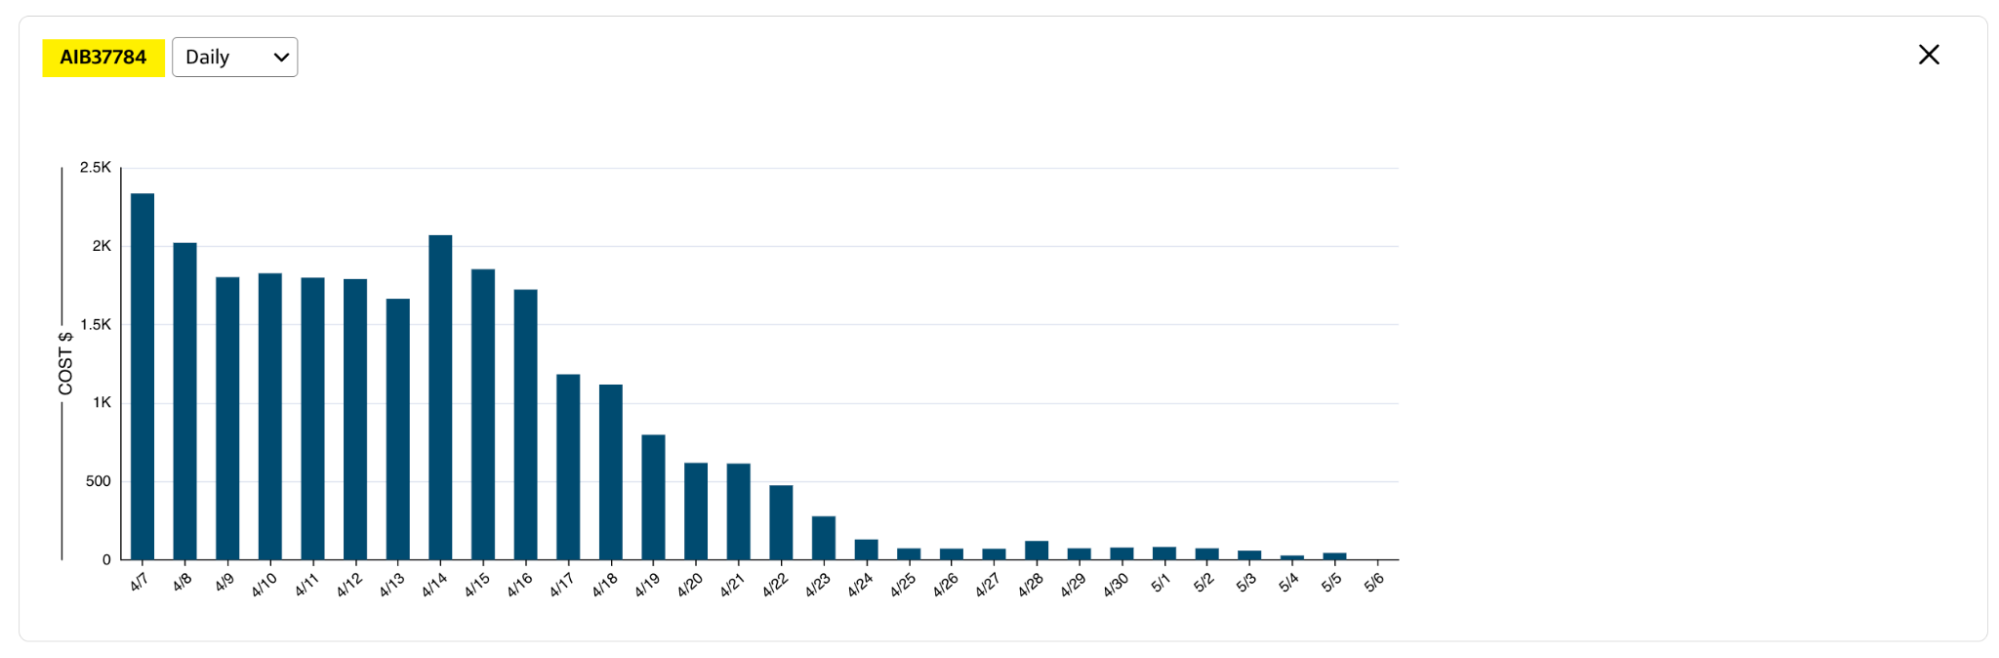
- To display an overlay chart for the incremental costs associated with a specific account, select the Account name from the table column.
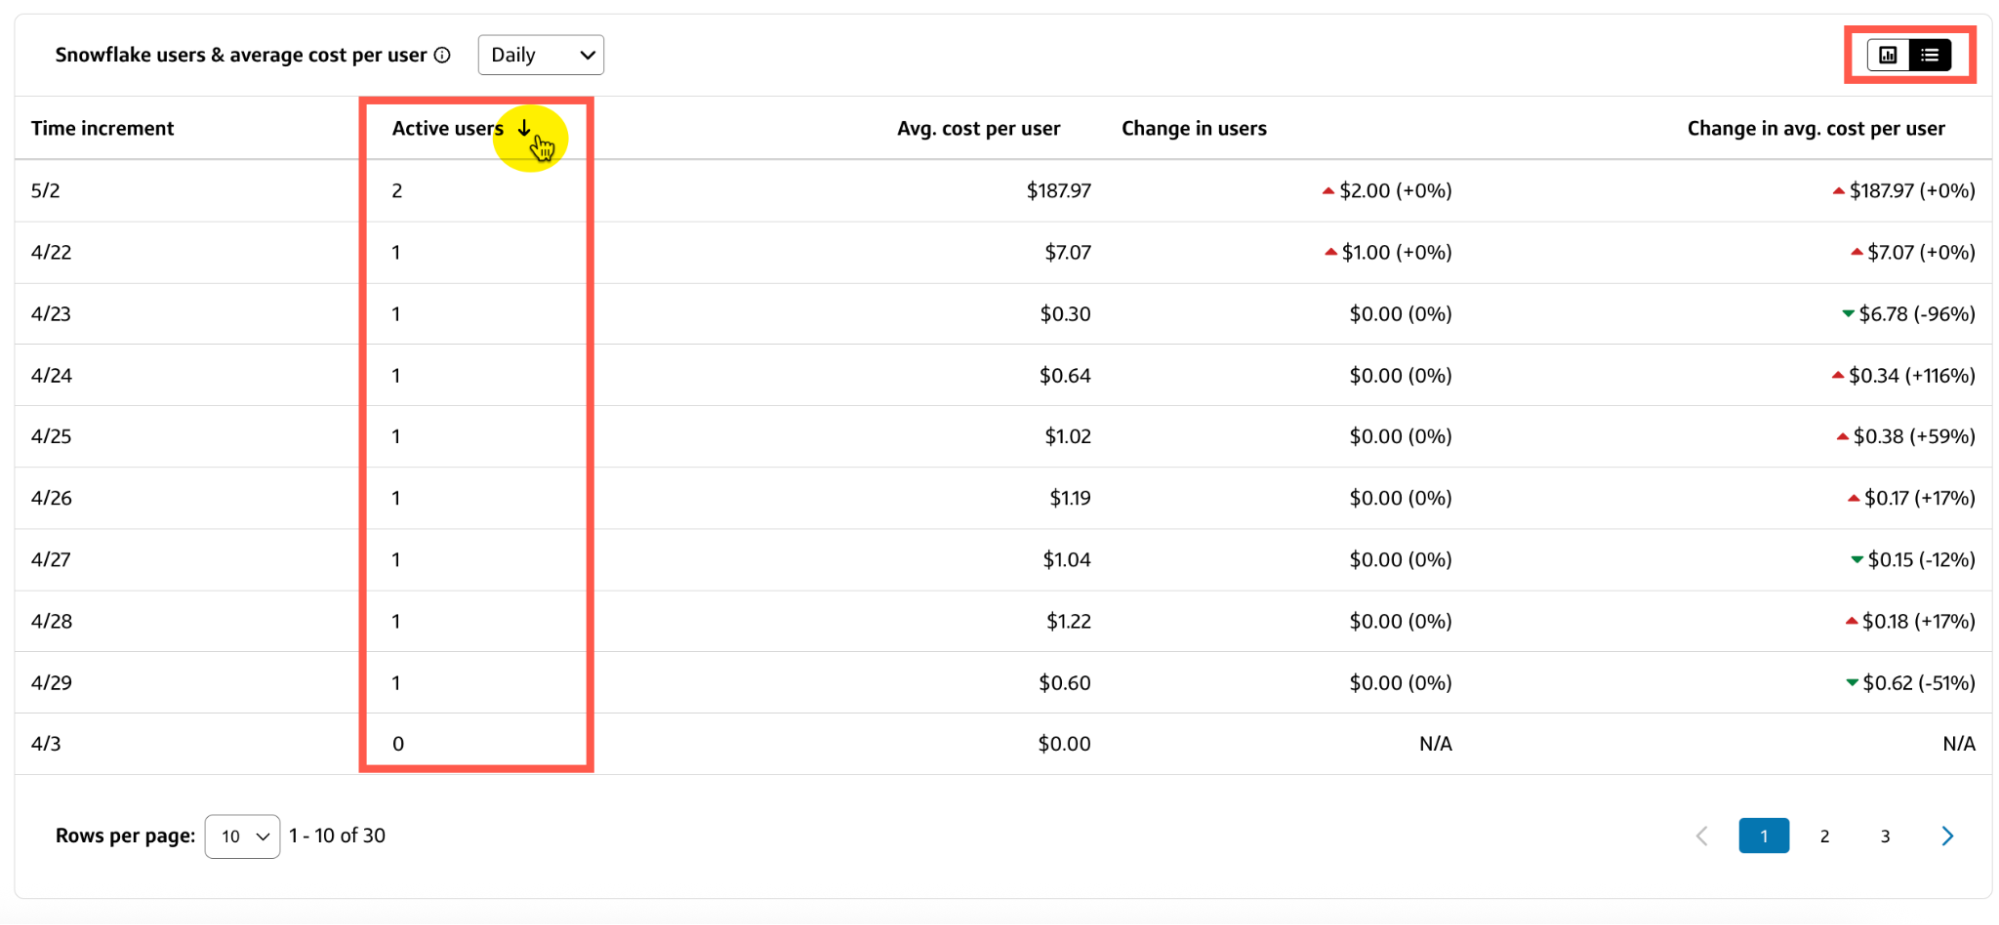
Snowflake users & average cost per user
The Snowflake users & average cost per user chart or table on the Snowflake tab displays the number of Active users, Avg. cost per user, Change in users, and Change in avg. cost per user for each Time increment in the selected date range.
- You can select a different time increment from the Cost by account dropdown to change the view without affecting the other charts and tables on the Snowflake tab.
- To switch between chart and table views, select the corresponding toggle in the top-right corner of the current view.
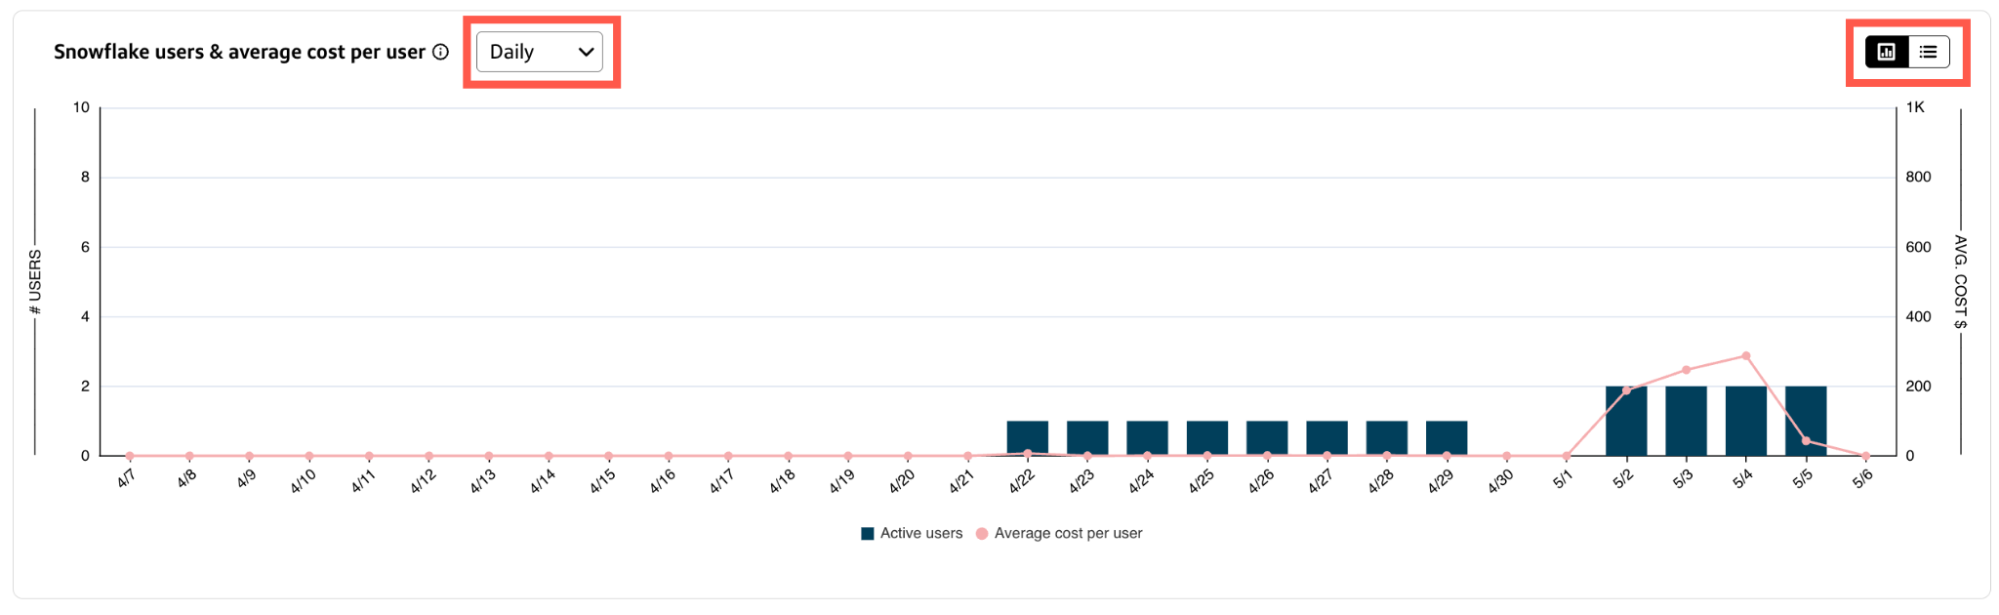
Chart view
- Hover over a bar in the chart to view a breakdown of your Snowflake costs by active users, average cost per user, change in users, and change in average cost per user for a specific time increment.
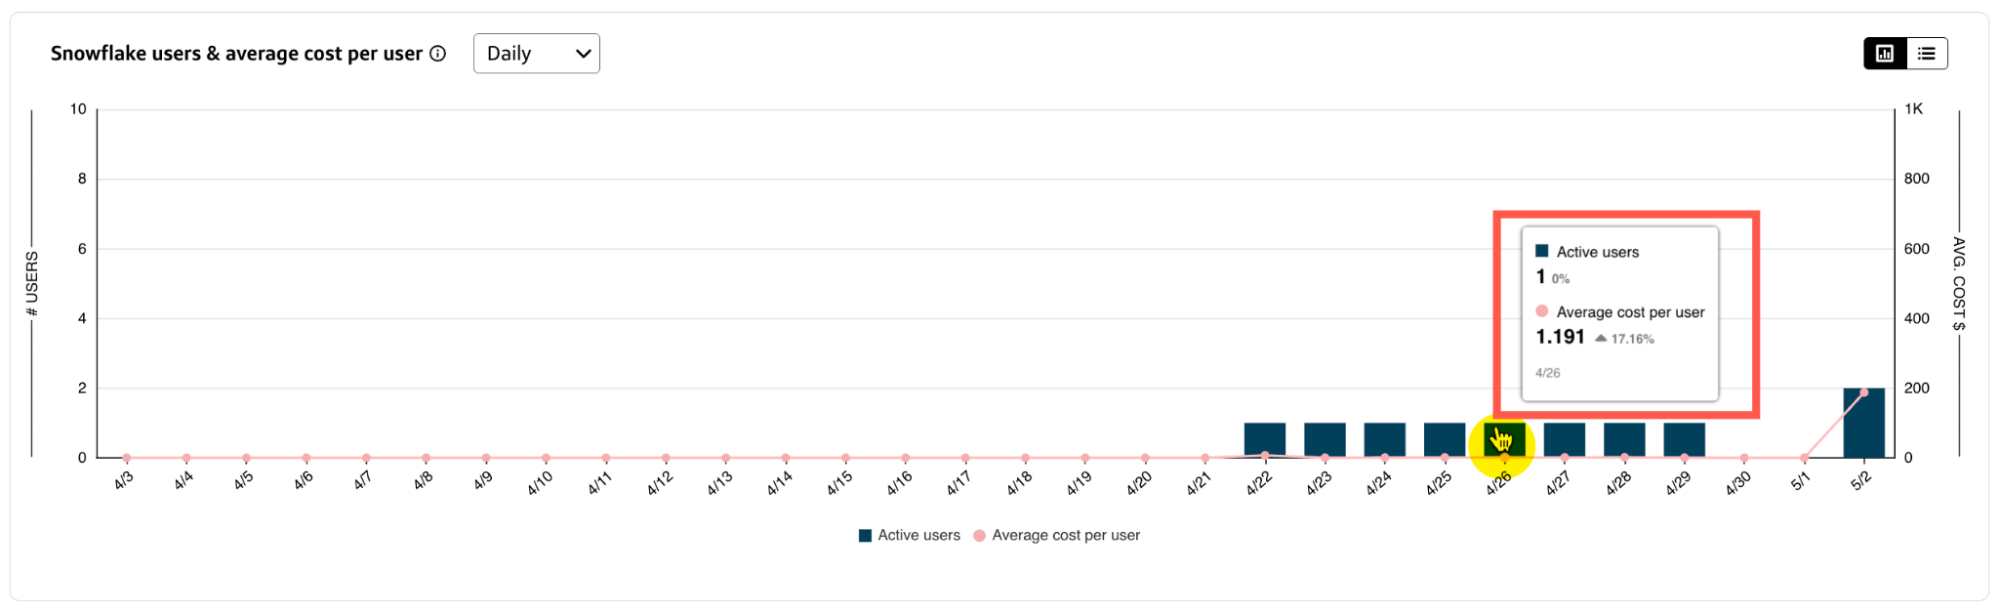
Table view
- Select a column heading to sort the table by Time increment, Active users, Avg. cost per user, Change in users, or Change in avg. cost per user.
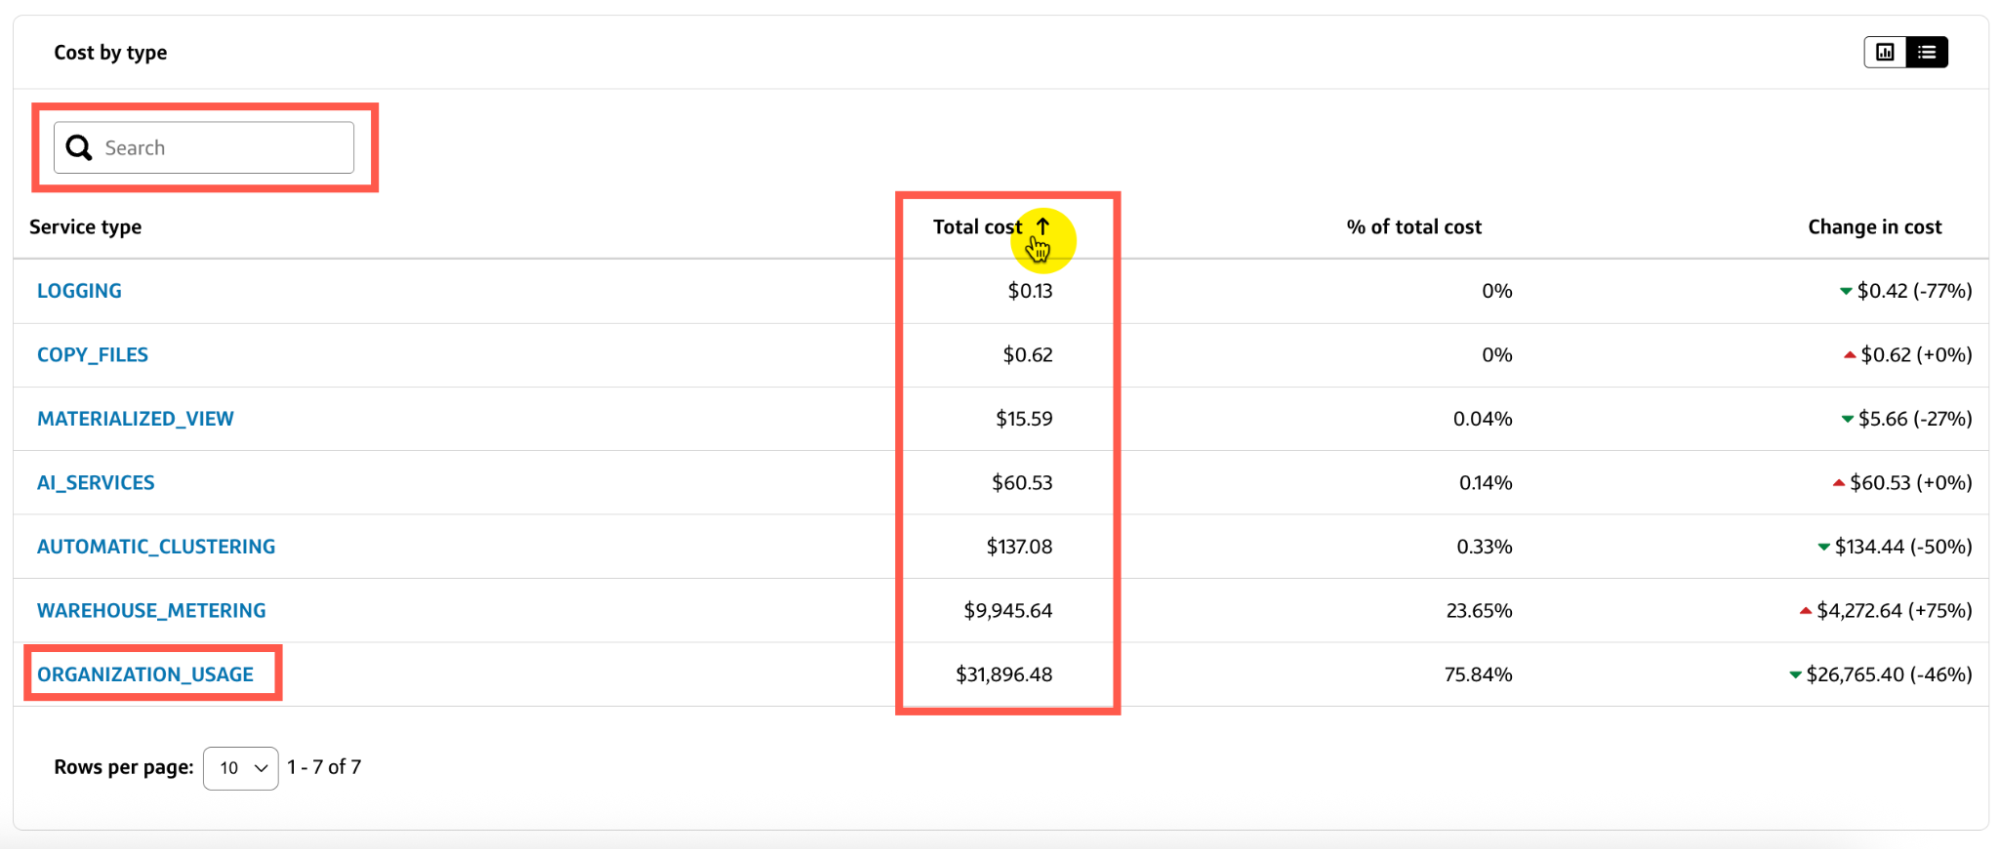
Cost by type
The Cost by type chart or table on the Snowflake tab displays the total cost, percent of total cost, and change in cost for each service type in the selected date range.
- To switch between chart and table views, select the corresponding toggle in the top-right corner of the current view.
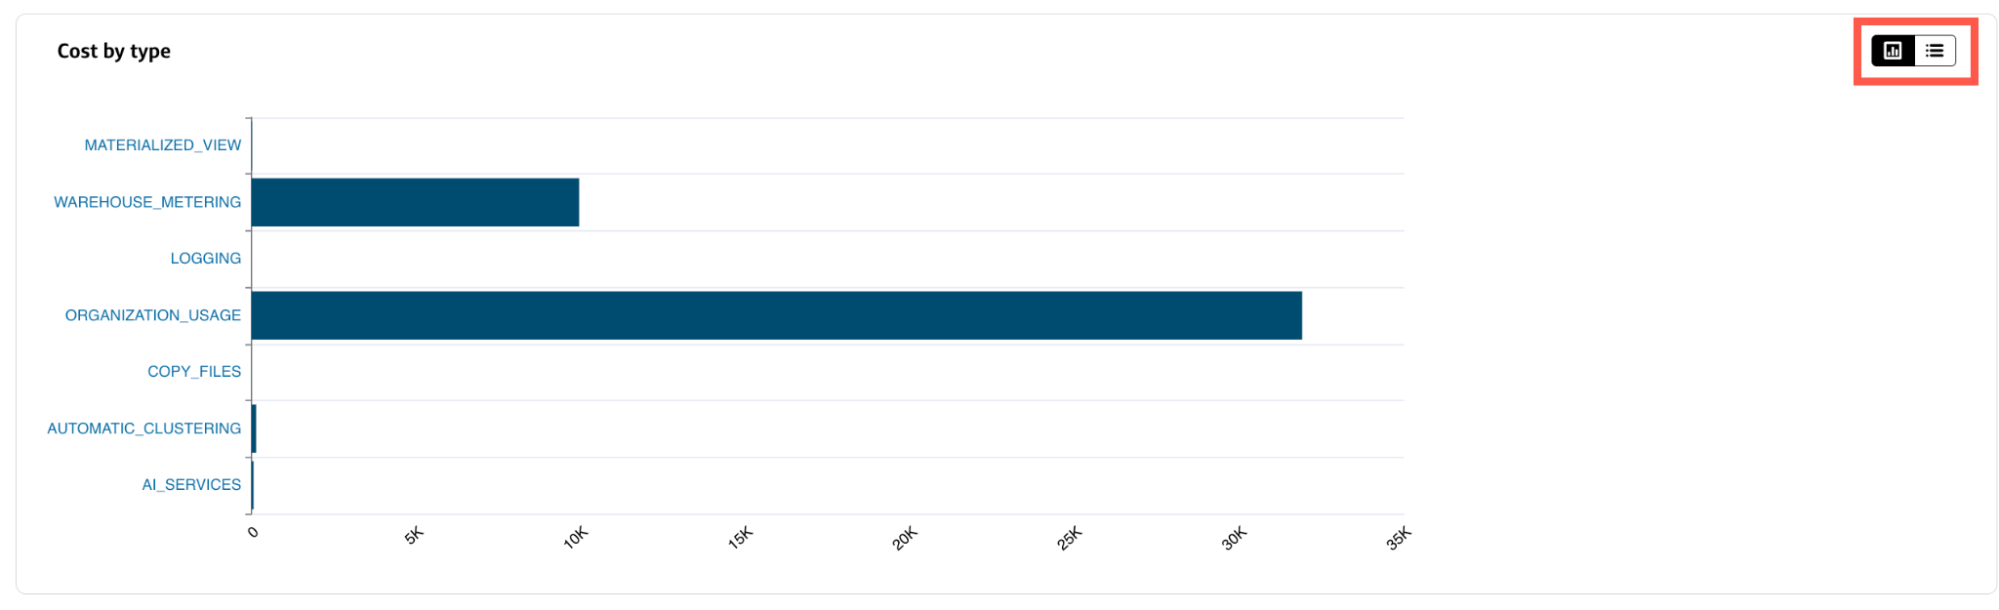
Chart view
- Hover over a bar in the chart to view the total cost for that service type.
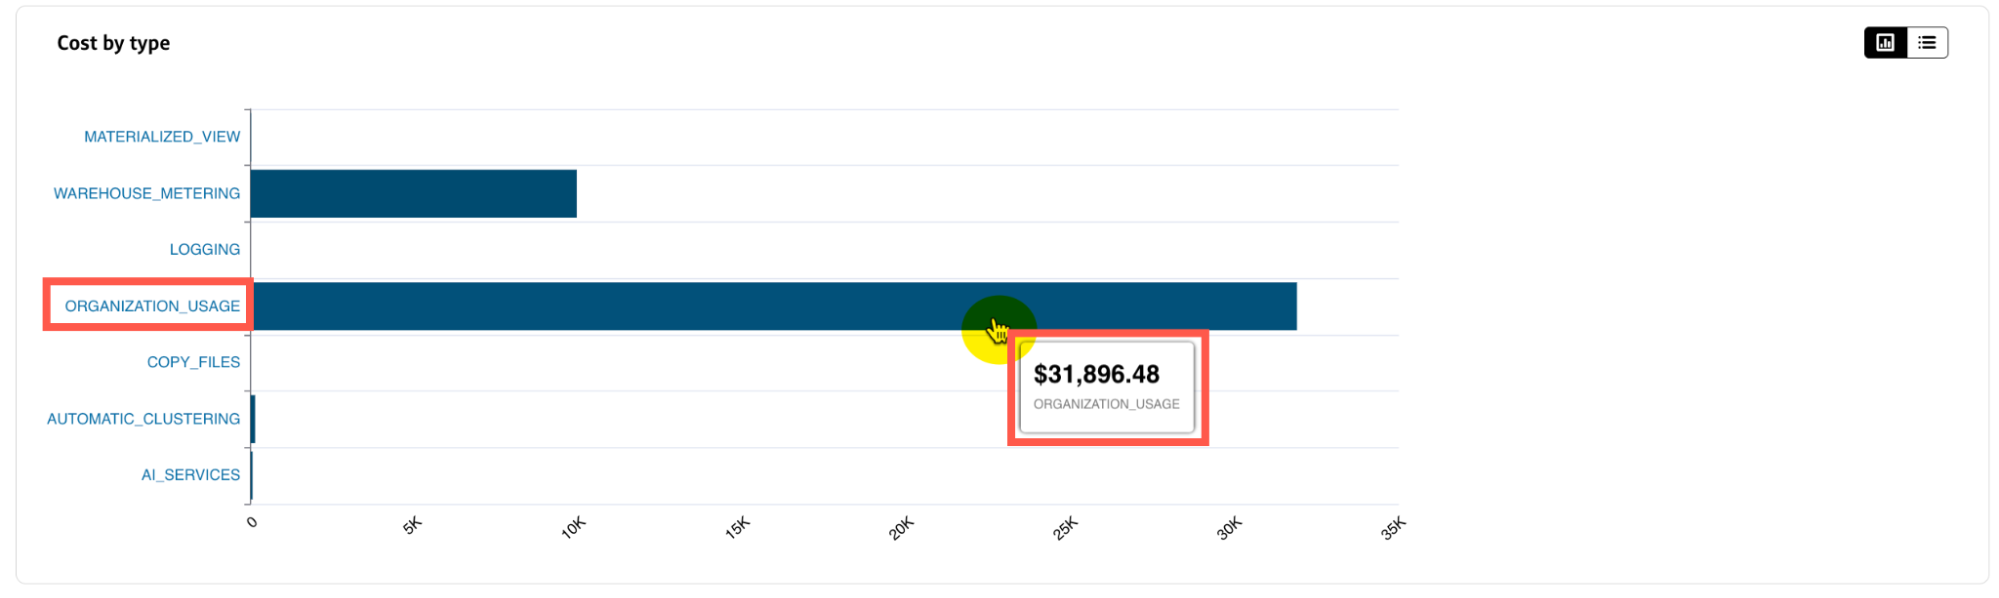
To view incremental costs associated with a specific service type:
- Select the service type from the y-axis of the Cost by type chart.
- In the overlay chart that appears, hover over a bar to view the total cost and change in cost for a specific time increment.
- You can select a different time increment from the dropdown to change the view without affecting the other charts and tables on the Snowflake tab.
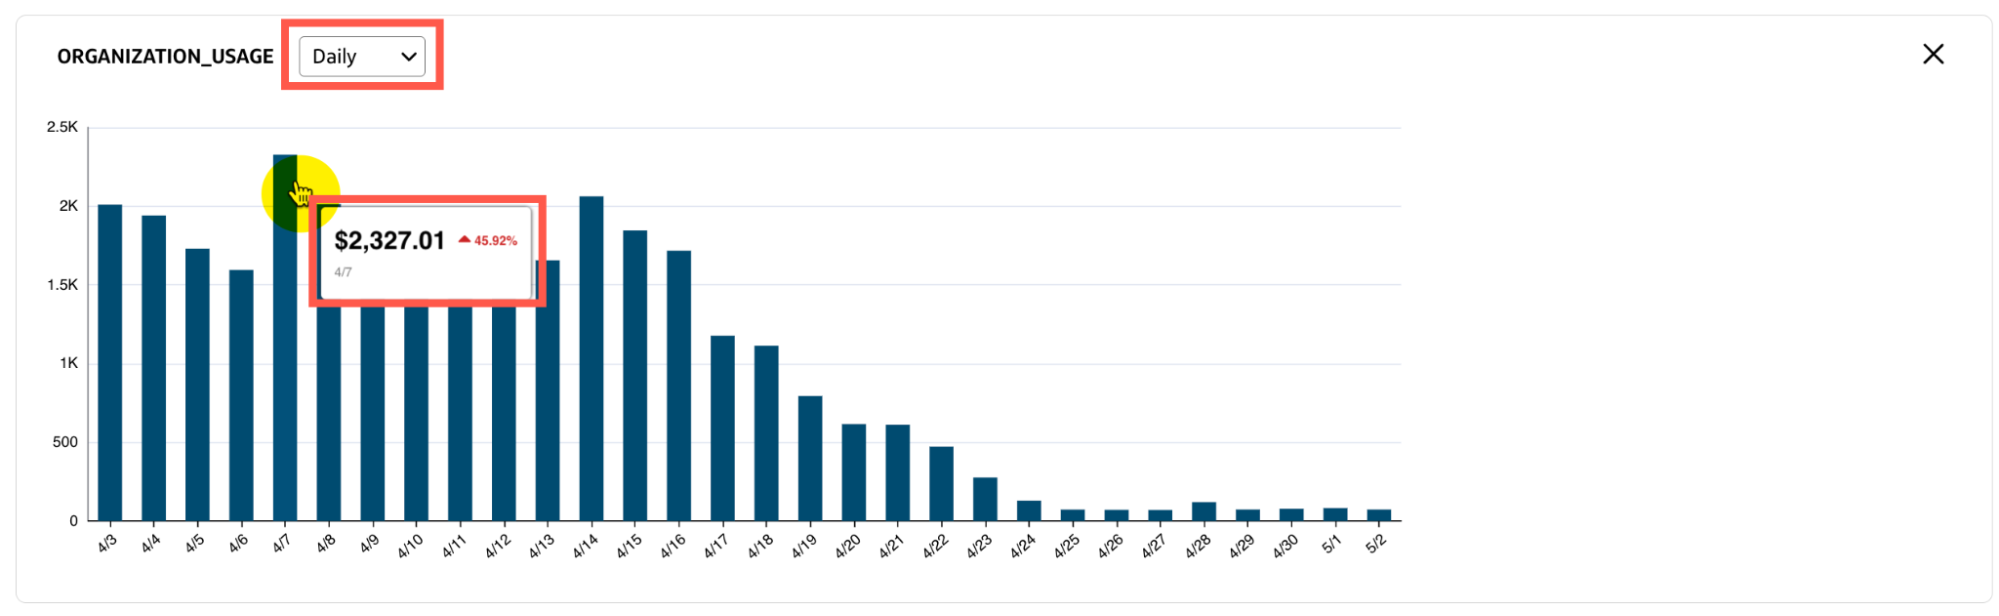
Table view
The Cost by type table lists the Total cost, % of total cost, and Change in cost for each Service type.
- Select a column heading to sort the table by that field.
- Use the Search bar to filter the table by a specific field value, such as part of a Service type name or a number in a cost.
- Select a Service type name from the table column to view incremental costs associated with the specific service type.
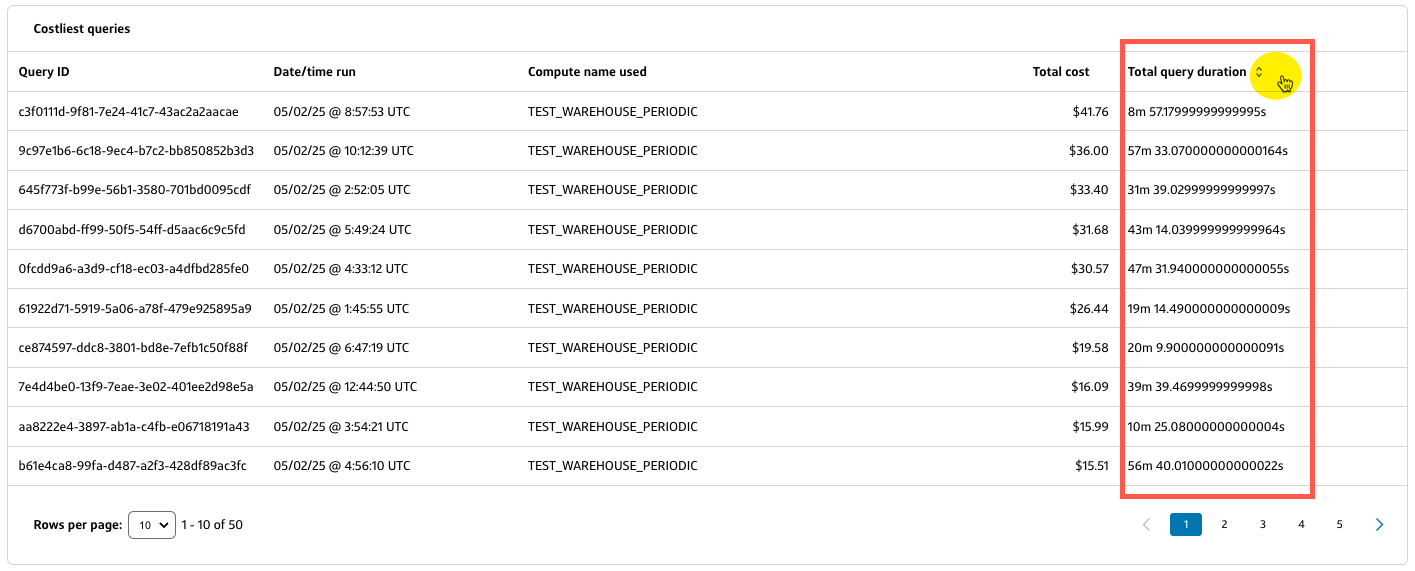
Costliest queries
The Costliest queries table lists the Date/time run, Compute name used, Total cost, and Total query duration for each Query ID that ran during the selected date range.