Databricks jobs
Overview
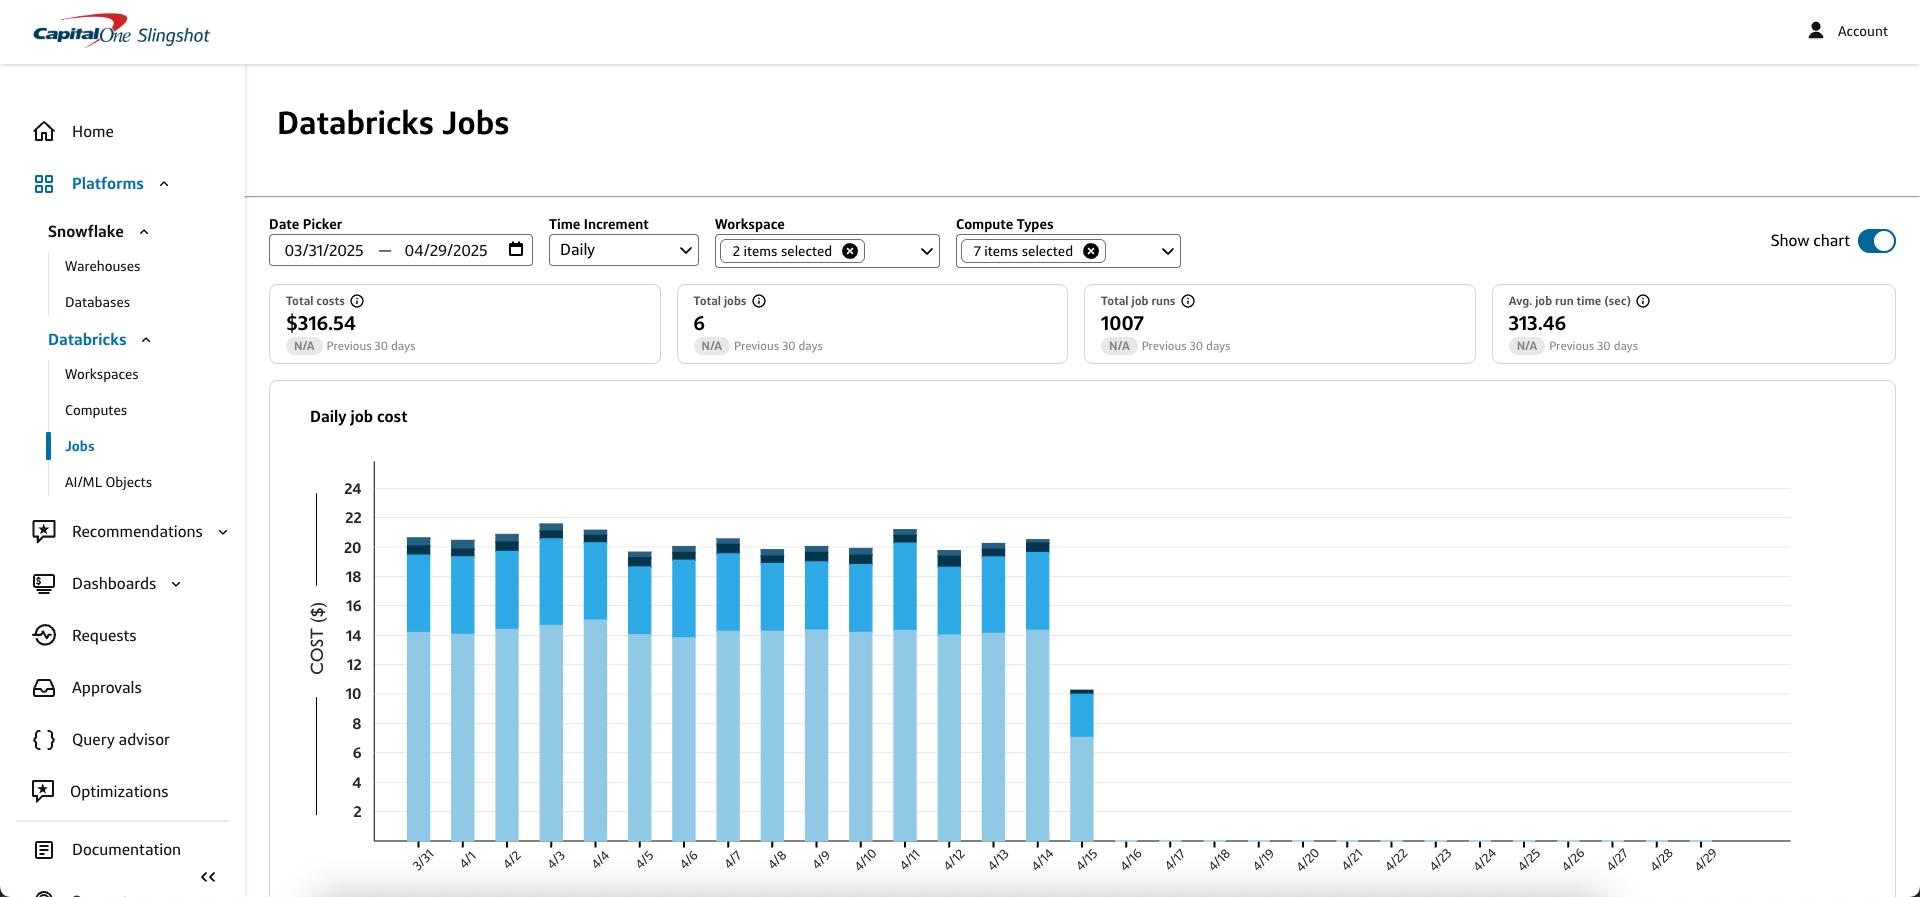
The Databricks jobs page provides a unified view of costs and usage across all of your Databricks job runs in a chart or table.
- To access the Databricks jobs page from the Slingshot left sidebar menu, navigate to Platforms > Databricks > Jobs.
You can customize the data in both the chart and table by:
- Date picker: Select a custom data range or use one of the preset date ranges.
- Time increment: Select a time increment from the dropdown. Depending on the date range you selected, your time increment can be Daily, Weekly, or Monthly.
- Workspace: Select the Databricks workspace IDs that you want to include in the chart or table.
- Compute types: Select the Databricks compute types that you want to include in the chart or table.
The costs and usage data displayed on the Databricks jobs page include:
- Total costs: Includes total costs for jobs run on all-purpose compute, total costs are an estimation. Values reflect jobs matching any of your selected compute types.
- Total jobs: Includes job runs that include any tasks. Values reflect jobs matching any of your selected compute types.
- Total job runs: Total number of runs across all jobs. Values reflect jobs matching any of your selected compute types.
- Avg. job run time: Calculated as total run time divided by total number of jobs. Values reflect jobs matching any of your selected compute types.
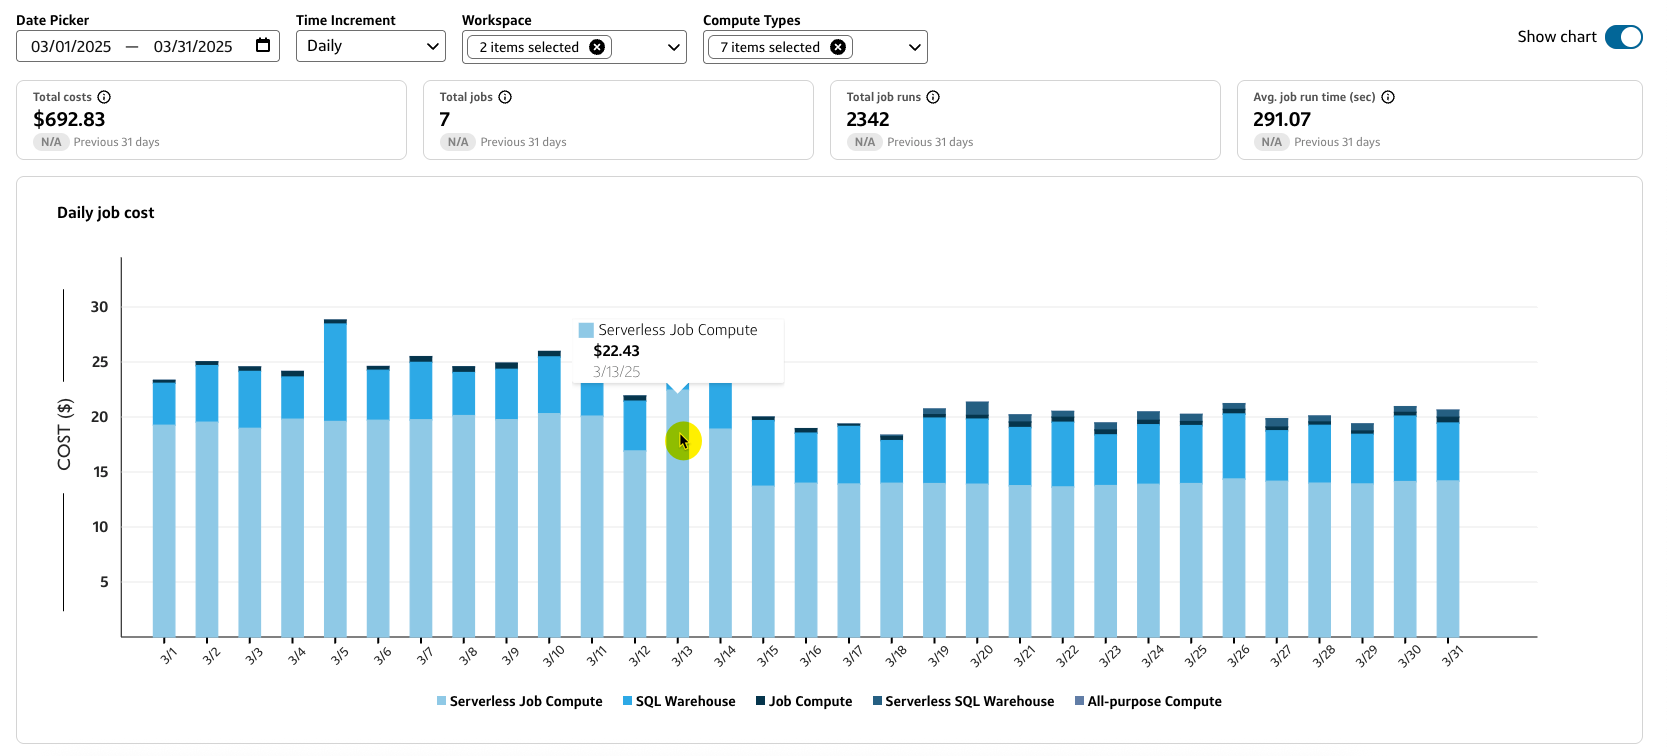
Jobs chart
The Jobs chart provides a graphical representation of the job costs for your selected date range and time increment by Compute type.
- You can hover over a specific bar segment to view the Compute type and job costs for a specific time increment.
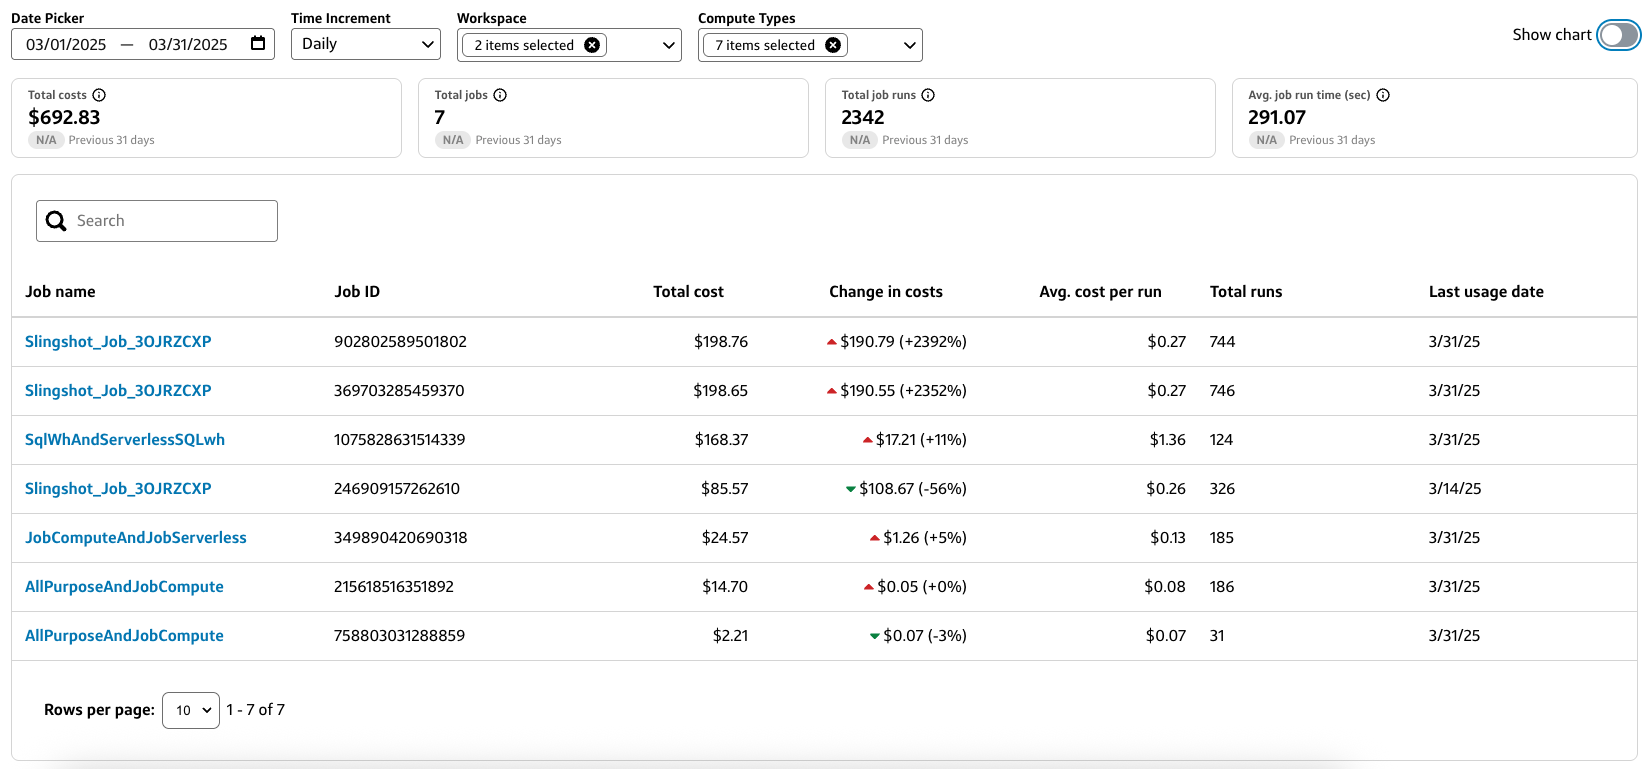
Jobs table
The Jobs table lists all your selected job runs by Job name, Job ID, Total cost, Change in costs, Avg. cost per run, Total runs, and Last usage date.
- Select a column heading to sort the table by that field.
- Use the Search bar to filter the table by a specific field value, such as part of a Job name or Job ID.
- Select a Job name to view details for that particular job run.