Job details
Overview
The Job details page displays more granular information for the specific Job name you selected on the Jobs table, including the Avg. daily cost for the job and Slingshot best practice recommendations (if any).
ℹ️
The Avg. daily cost displayed on the Job details page is based on the date range you selected on the Databricks jobs page.
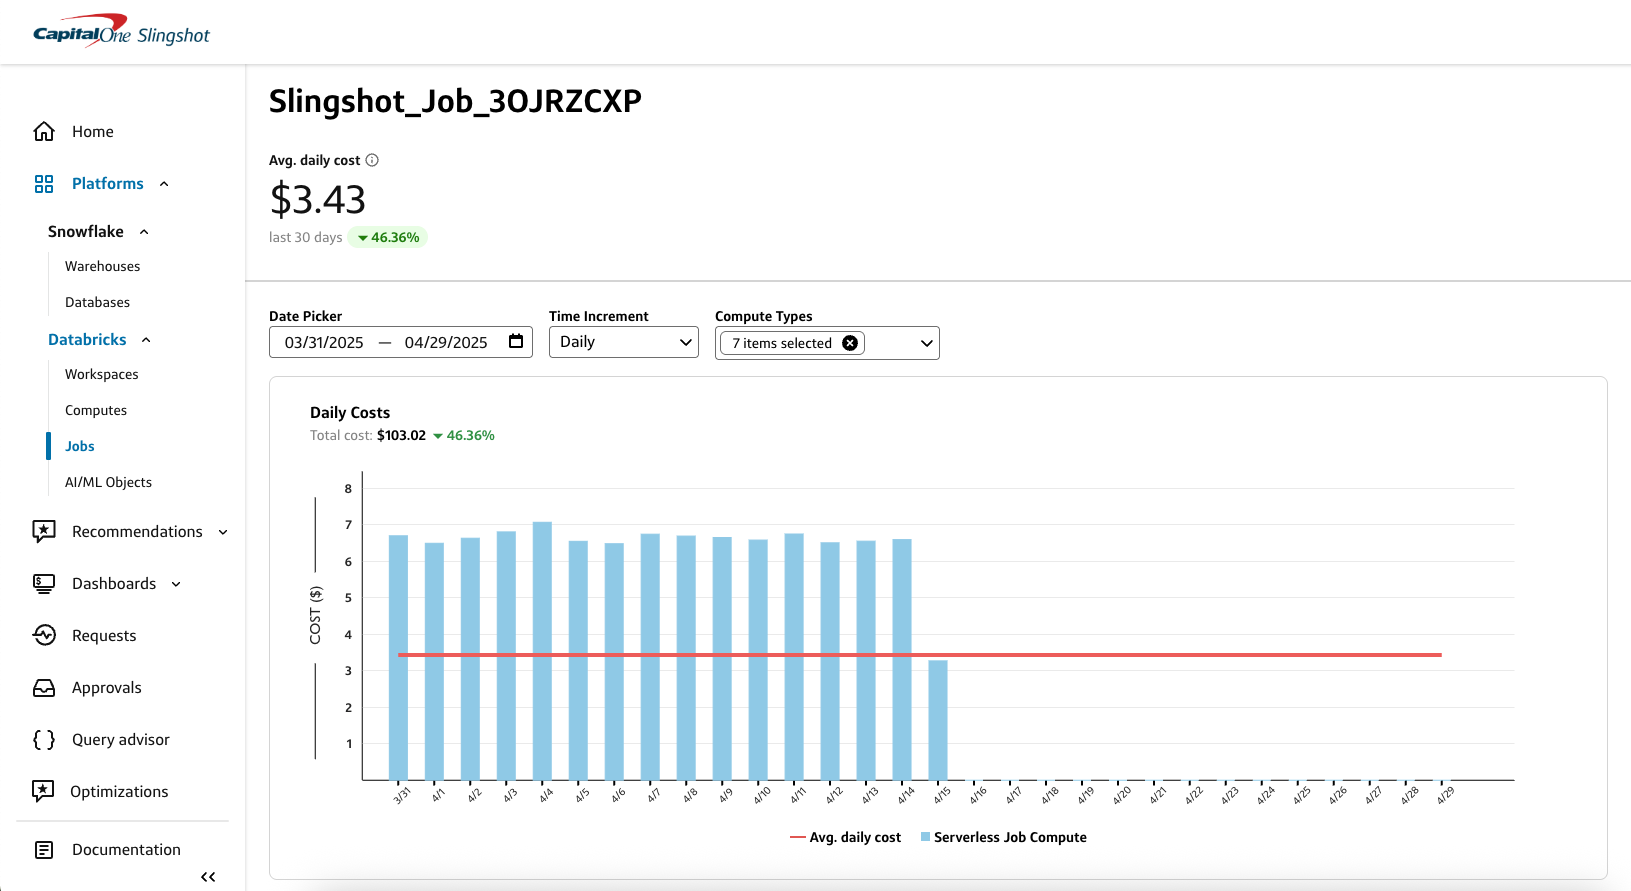
You can customize the data in both the chart and table by:
- Date picker: Select a custom data range or use one of the preset date ranges.
- Time increment: Select a time increment from the dropdown. Depending on the date range you selected, your time increment can be Daily, Weekly, or Monthly.
- Compute types: Select the Databricks compute types that you want to include in the chart or table.
In the right sidebar, you can also view the Settings and Change history for the selected job.
- Settings: Displays the job name, job owner, number of tasks, duration threshold, and max concurrent runs.
- Change history: You can select a date from the change history to view the settings from that point in time.
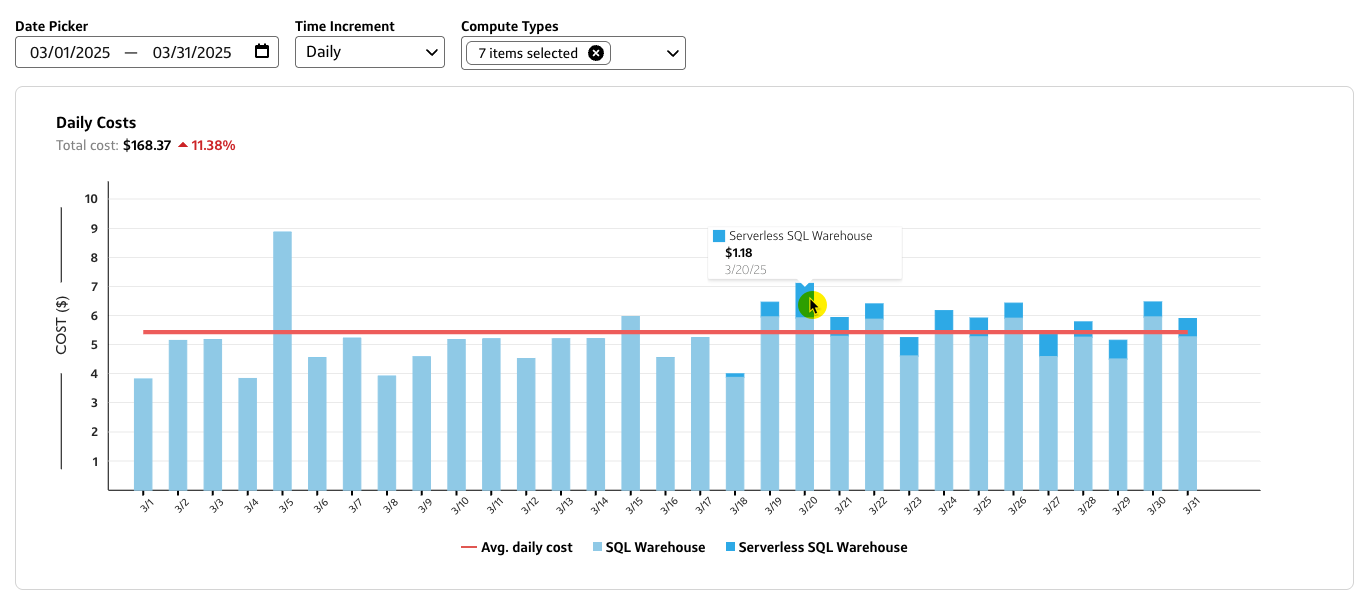
Job details chart
The Job details chart provides a graphical breakdown of costs for the job based on the selected date range, time increment, and compute types.
- You can hover over a specific bar segment to view the object type and total costs for a specific time increment.
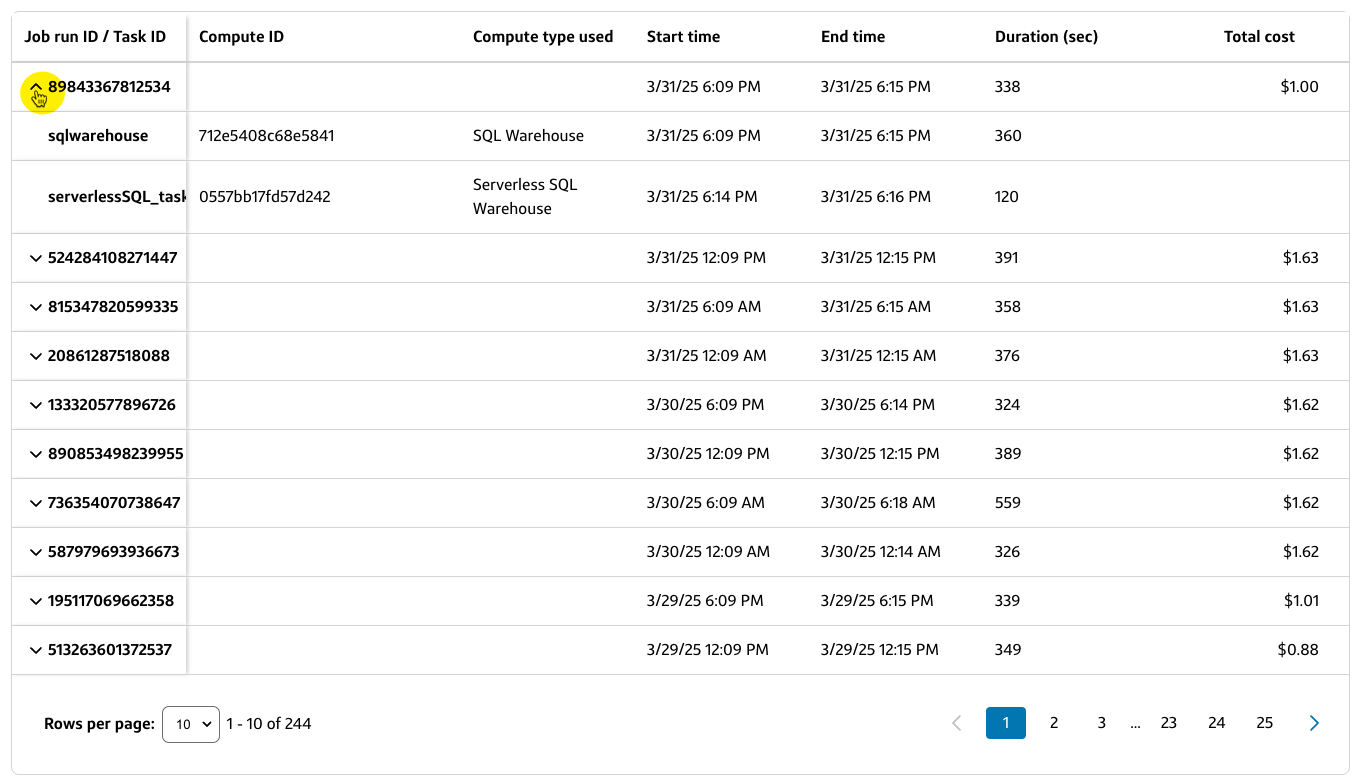
Job details table
The Job details table provides a tabular view of the Compute ID, Compute type used, Start time, End time, Duration (sec), and Total cost for each Job run ID / Task ID.
- Select a column heading to sort the table by that field.
- Select the carat icon next to a Job run ID / Task ID to view the compute names, compute IDs, and compute types used by the job.