Databricks workspaces
Overview
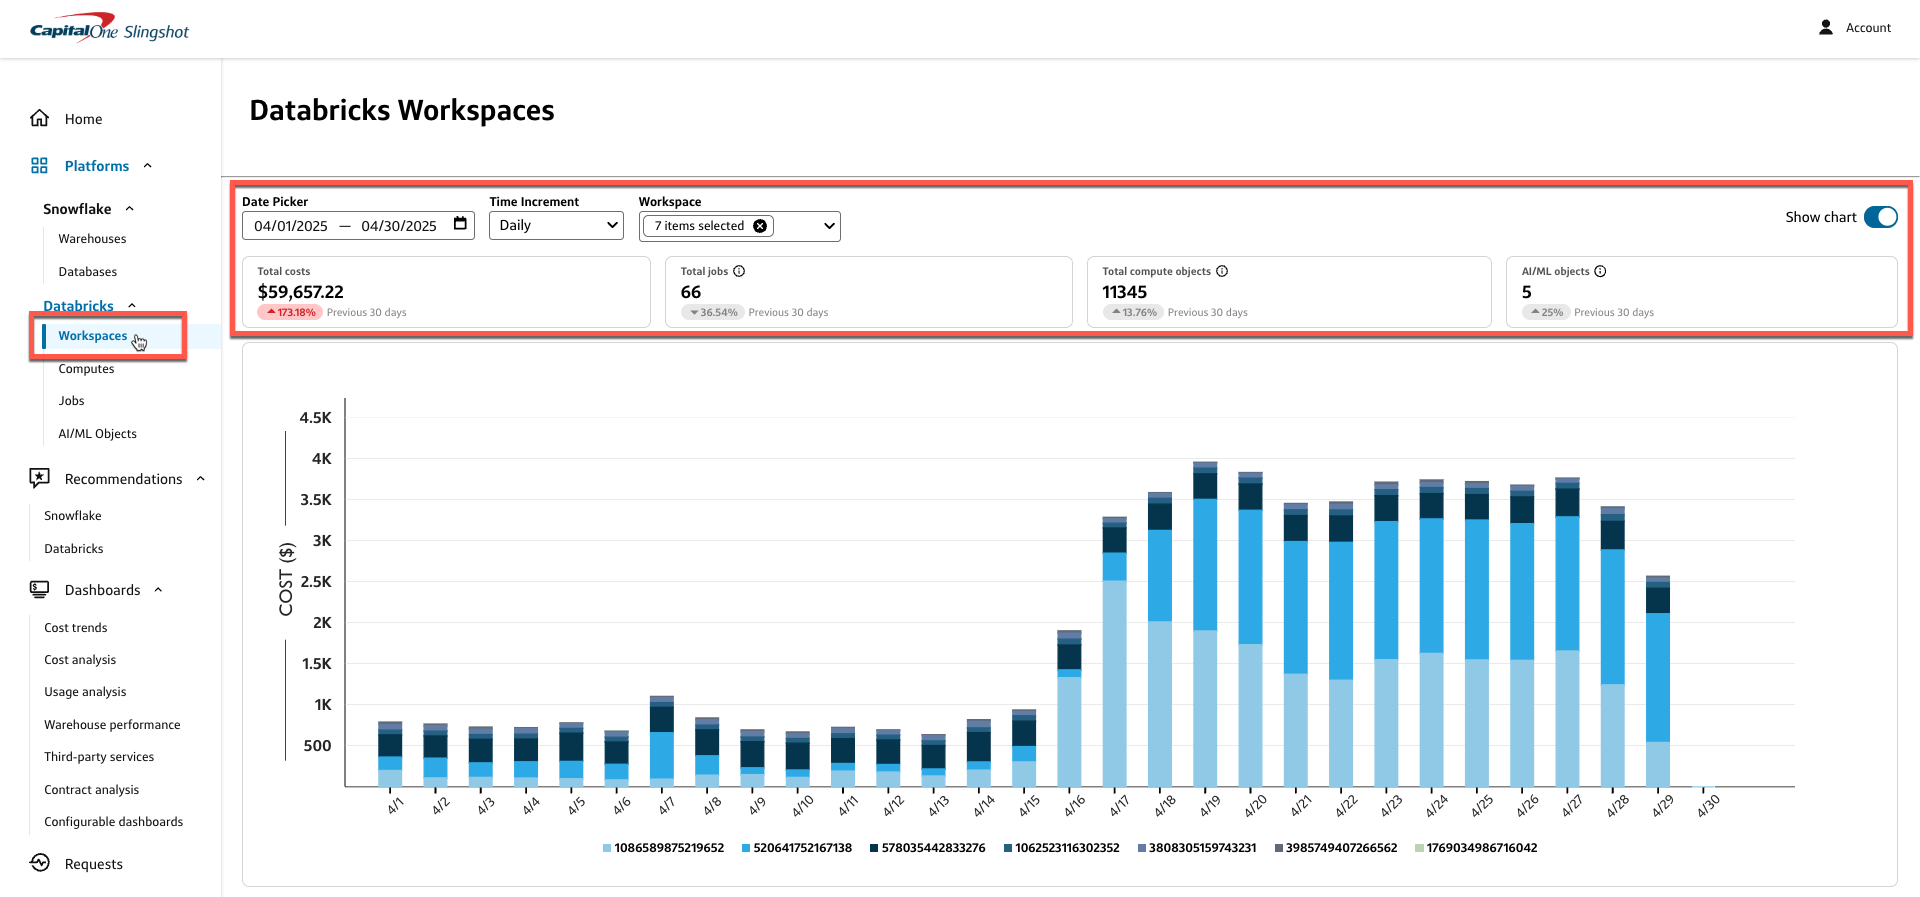
The Databricks workspaces page provides a unified view of costs and usage across all of your Databricks workspaces in a chart or table.
- To access the Databricks workspaces page from the Slingshot left sidebar menu, navigate to Platforms > Databricks > Workspaces.
You can customize the data in both the chart and table by:
- Date picker: Select a custom data range or use one of the preset date ranges.
- Time increment: Select a time increment from the dropdown. Depending on the date range you selected, your time increment can be Daily, Weekly, or Monthly.
- Workspace: Select the workspace IDs of the workspaces you want to include in the chart or table.
The costs and usage data displayed on the Databricks workspaces page include:
- Total costs: Includes total costs across all your Databricks workspaces for the selected date range.
- Total jobs: Includes job runs on any type of compute.
- Total compute objects: Includes jobs compute, all-purpose compute, SQL warehouses, serverless jobs compute, serverless all-purpose compute, serverless SQL warehouses, and Delta Live Tables.
- AI/ML objects: Includes model-serving endpoints and vector search endpoints.
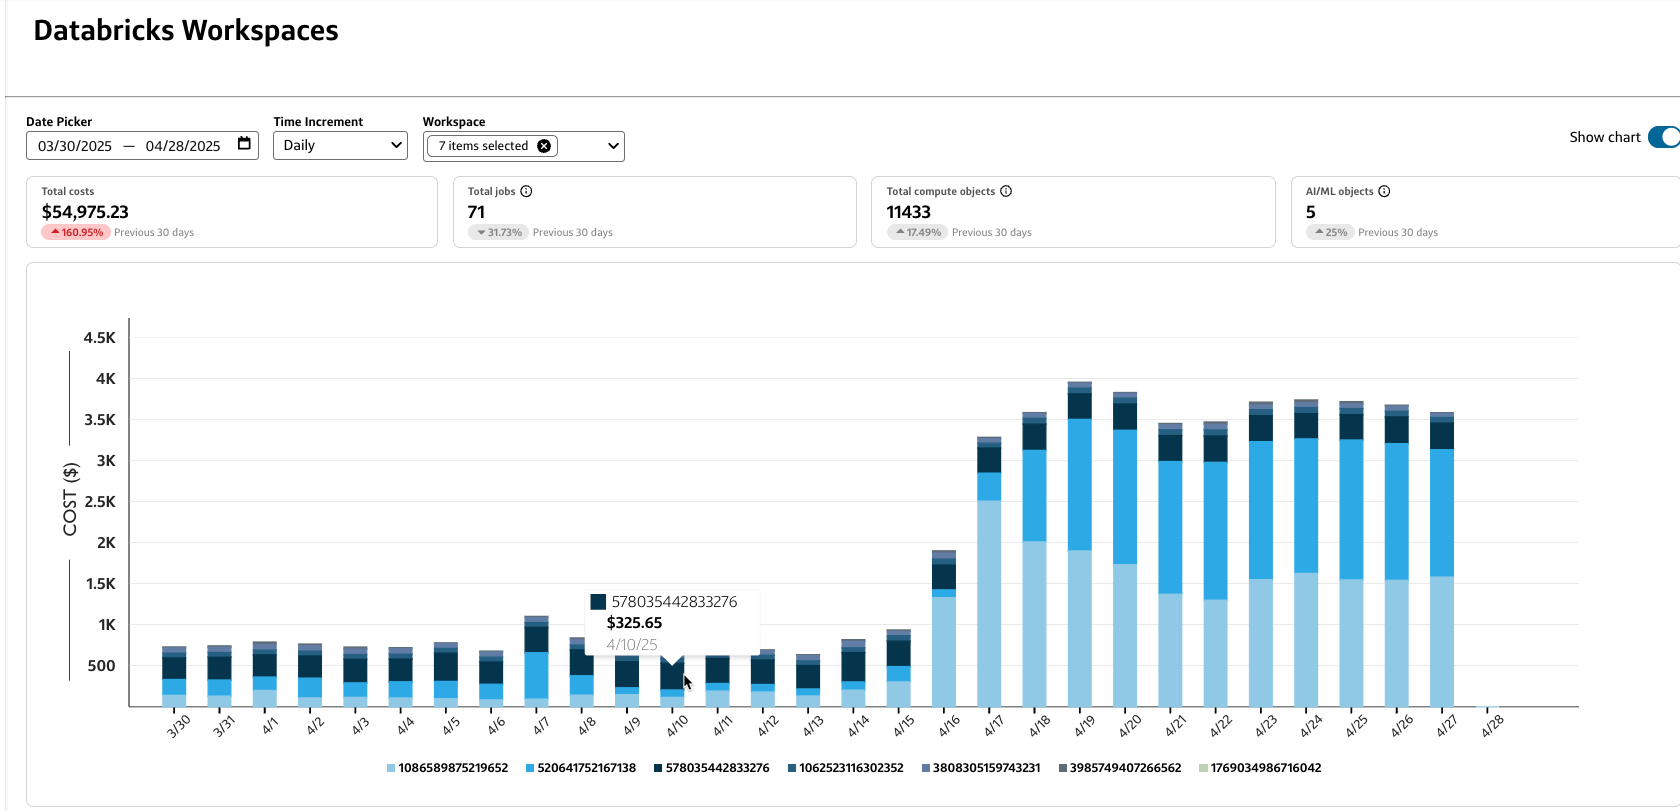
Workspaces chart
The Workspaces chart provides a graphical representation of the total costs for your selected date range and time increment by Workspace ID.
- You can hover over a specific bar segment to view the Workspace ID and total costs for a specific time increment.
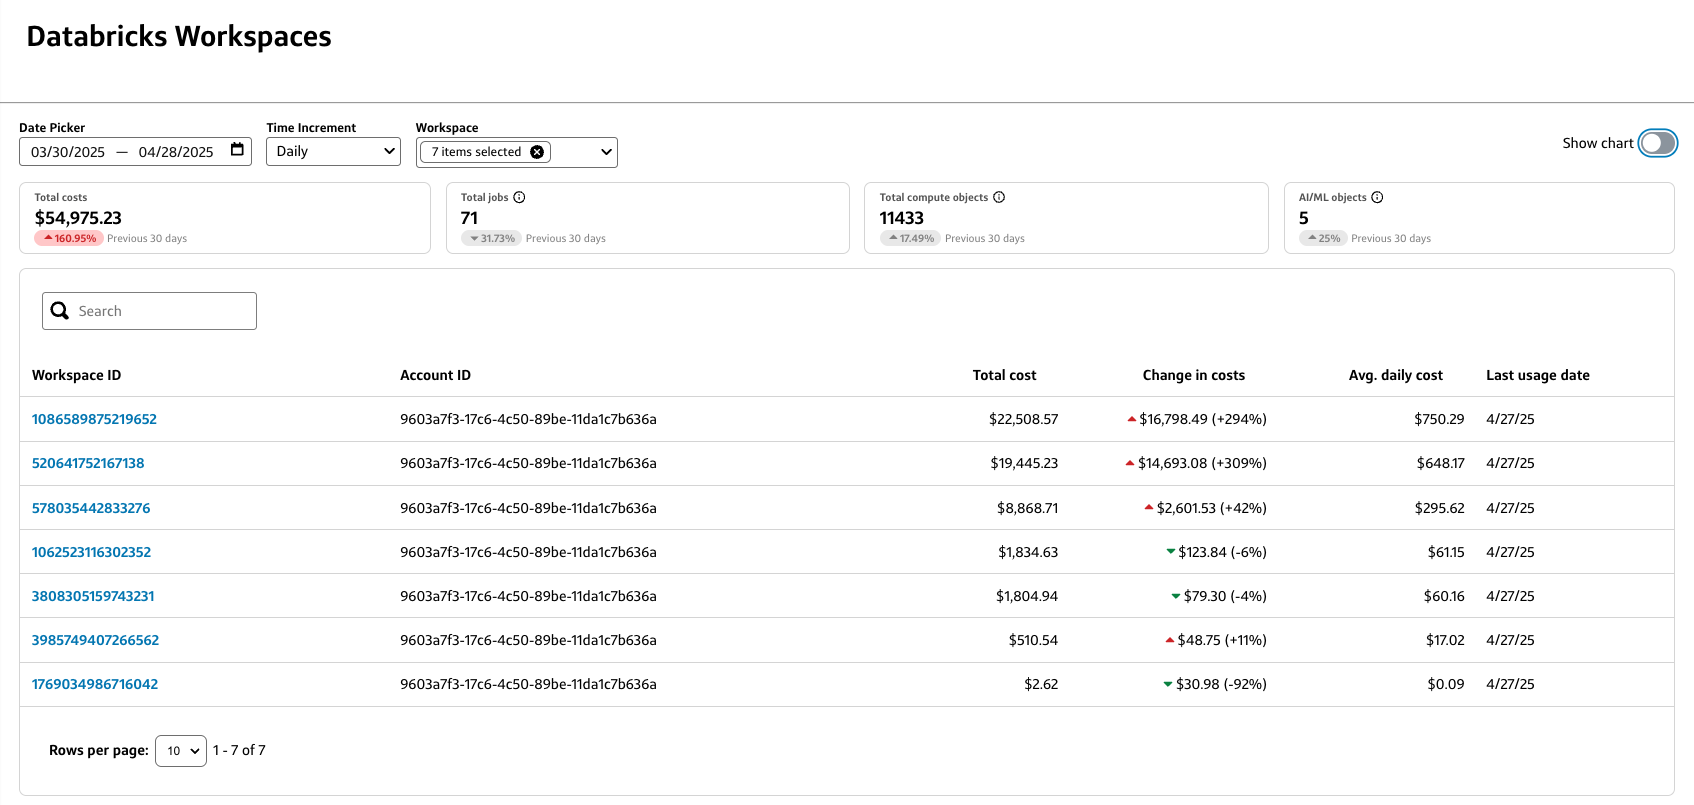
Workspaces table
The Workspaces table lists all your selected workspaces by Workspace ID, Account ID, Total cost, Change in costs, Avg. daily cost, and Last usage date.
- Select a column heading to sort the table by that field.
- Use the Search bar to filter the table by a specific field value, such as part of a Workspace ID or Account ID number.
- Select a Workspace ID to view details for that particular workspace.