Workspace details
Overview
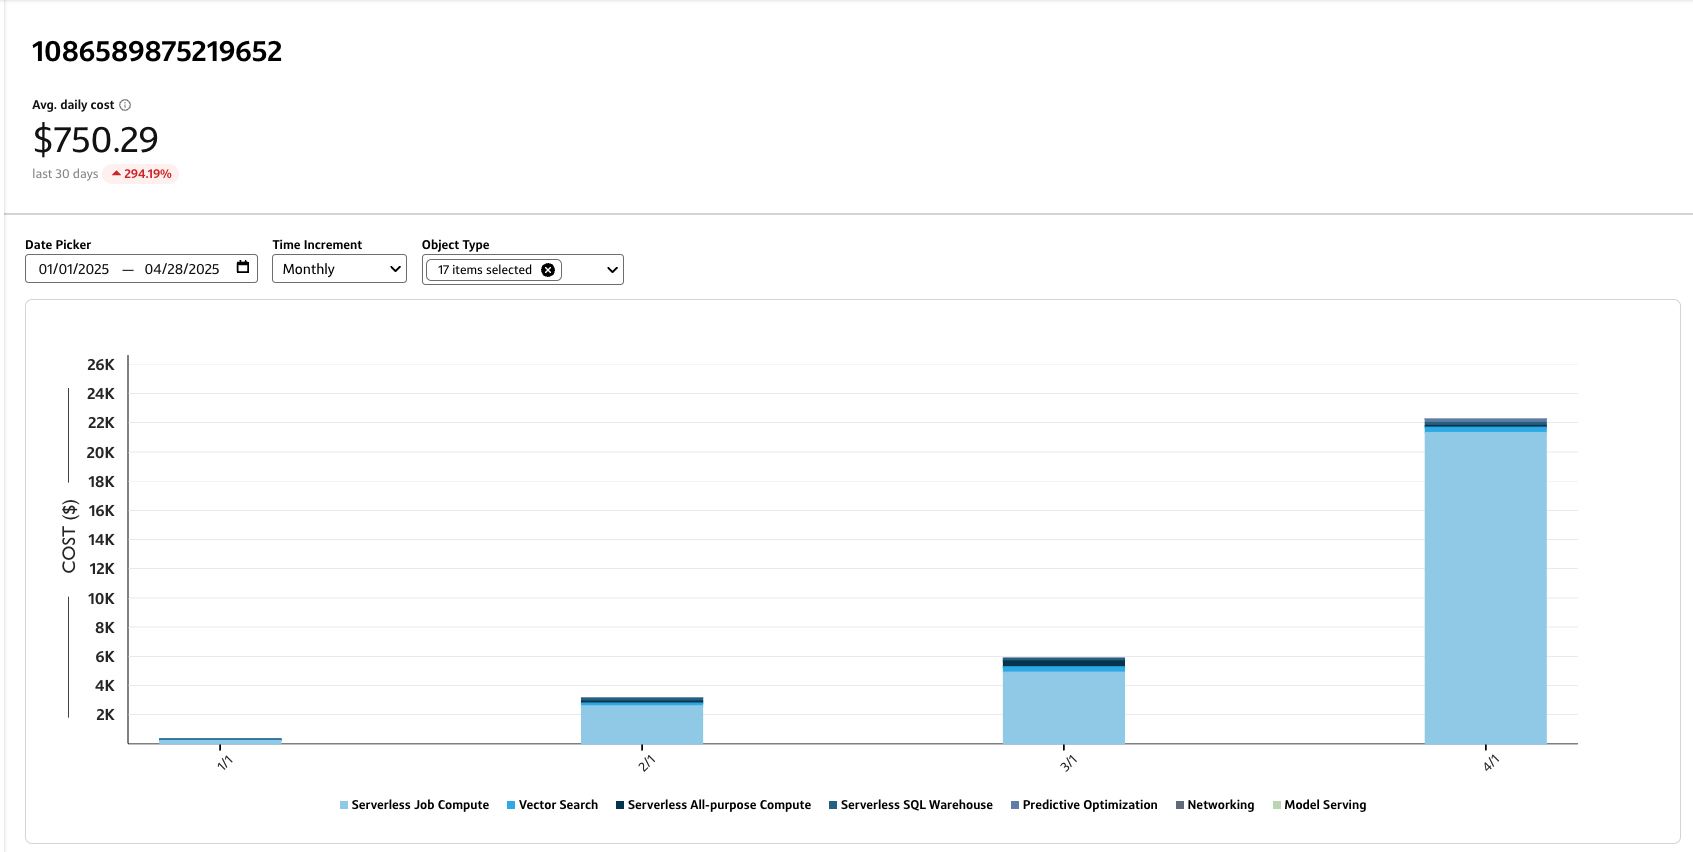
The Workspace details page displays more granular information for the specific Workspace ID you selected on the Workspaces table, including the Avg. daily cost for workspace.
ℹ️
The Avg. daily cost displayed on the Workspace details page is based on the date range you selected on the Databricks workspaces page.
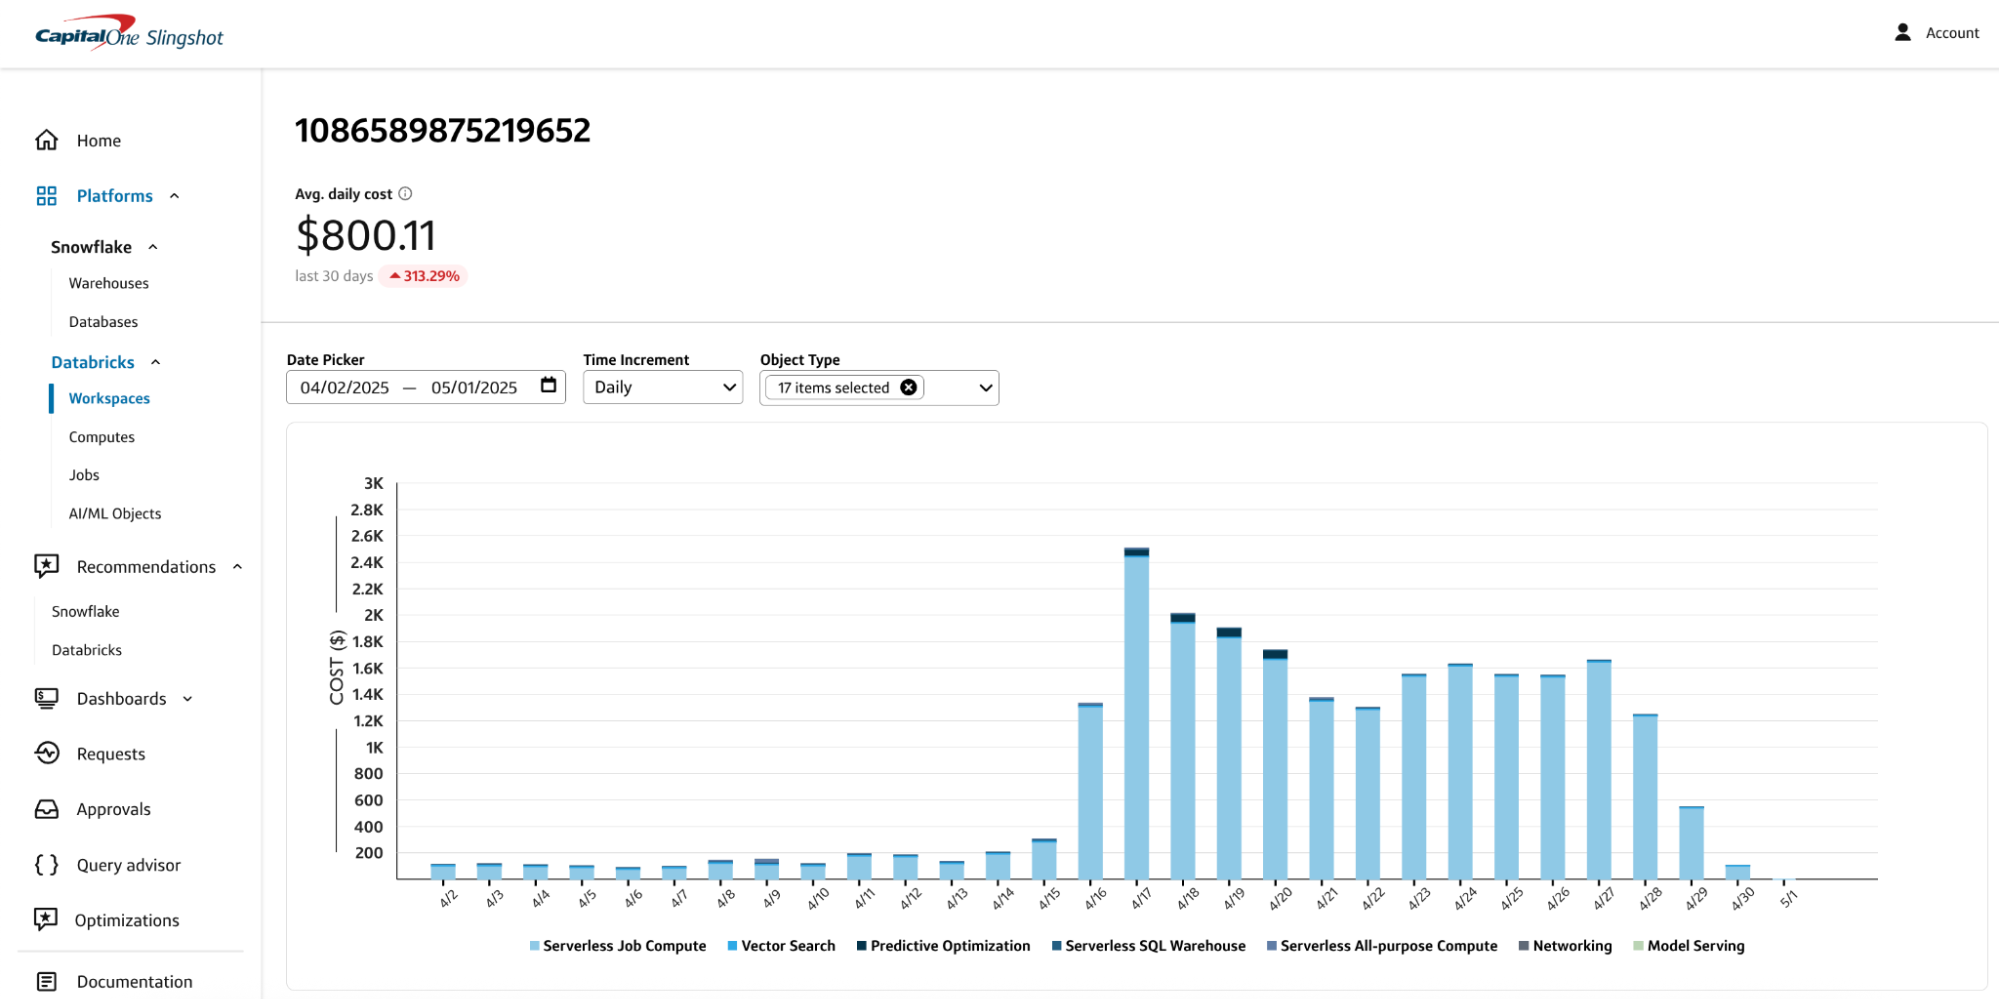
You can customize the data in both the chart and table by:
- Date picker: Select a custom data range or use one of the preset date ranges.
- Time increment: Select a time increment from the dropdown. Depending on the date range you selected, your time increment can be Daily, Weekly, or Monthly.
- Object type: Select the object types that you want to include in the chart and table.
Workspace details chart
The Workspace details chart provides a graphical breakdown of costs for the workspace based on the selected date range, time increment, and object types.
- You can hover over a specific bar segment to view the object type and total costs at a specific time increment.
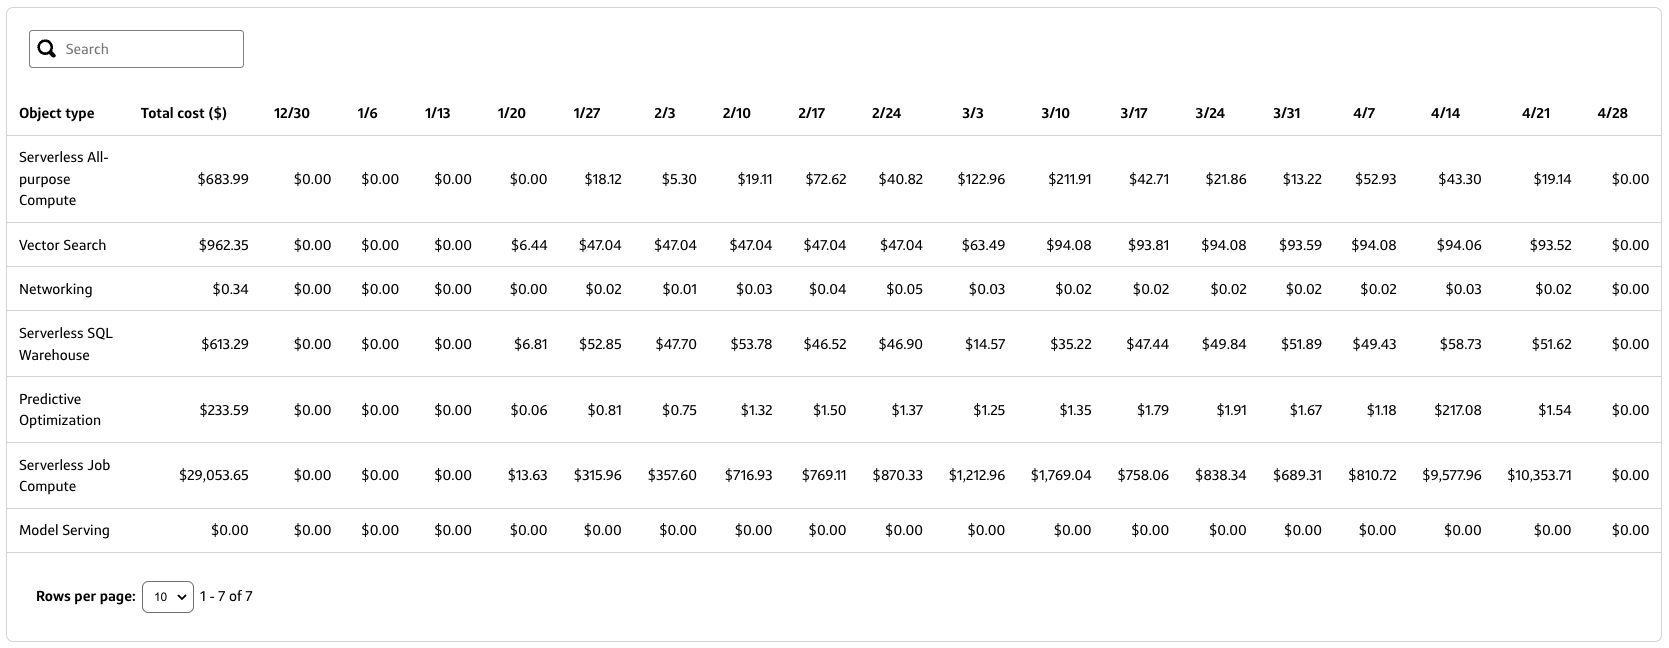
Workspace details table
The Workspace details table provides a tabular view of the selected object types, their total costs, and incremental costs over the specified date range.
- Select a column heading to sort the table by that field.
- Use the Search bar to filter the table by a specific field value, such as a partial string match for an Object type name.