Cost analysis dashboard
Wondering where spend occurs? The Cost analysis dashboard provides transparency for your Snowflake expenses expenses. Review enterprise-wide costs across 4 categories including total, warehouse, database, and serverless costs, to allocate spending effectively; then create a Cost breakdown report.
Roles for viewing dashboards
- Total Costs:
- Tenant admin
- Warehouse Costs, Database Costs, Serverless Costs and Cost Breakdown Report:
- Tenant admin
- Snowflake admin
- Snowflake owner
- Snowflake viewer
- Snowflake approver 1 & 2ℹ️Org determines which objects a user can access in Slingshot. When a role is assigned to the parent org, the role has access to all of its child units.
Access the dashboard
To access cost analysis data:
- From the left navigation menu, go to Dashboards, then Cost analysis.
- Select a tab (Total costs, Warehouse costs, Database costs, or Serverless costs) to view additional details.
- Filter or export/view data for deeper analysis.
Total costs
The Total costs tab summarizes enterprise-wide costs and displays projections.
- Enterprise Cost by Day, Month, and Week: total costs by day,
month, or week within the contract period
- Select Day, Month, or Week from the pick list.
- Cost Types by Month: month-over-month costs for the duration of the contract
- Total Cost by Account: total cost by Snowflake account
- Total Cost by Type: costs grouped by usage type
- Enterprise Cost Projections: enterprise-wide cost projections for the contract period
- Warehouse Cost Projections: warehouse usage and cost during the contract period
- Database Cost Projections: database costs for the contract periodℹ️Machine learning models compare past costs with trends to generate projections. For Cost Projection visuals, select Edit forecast to open Forecast properties.
Warehouse costs
The Warehouse Costs tab slices warehouses by day, week, month, account, and environment; along with displaying warehouse cost projections, compute cost, month-over-month cost analysis, costliest users and queries, and warehouse costs by Business org.
- Warehouse Cost by Day, Month, Week: costs by day, month, or week
- Select Day, Month, or Week from the pick list.
- Warehouse Cost by Account: costs by Snowflake account
- Warehouse Cost by Environment: total warehouse cost by environment
- Warehouse Cost Projections: warehouse cost projections for the
contract periodℹ️Machine learning models compare past costs with trends to generate projections. For Cost Projection visuals, select Edit forecast to open Forecast properties.
- Compute Cost by Warehouse: costliest warehouse in descending order
- Delta In Compute Cost Between Periods by Day, Month, Week: compute cost trends between periods of time by days, months, or weeks
- Costly Users: top 100 users with the most compute costs in descending order
- Costly Queries: 50 costliest queries in descending order
- Warehouse Cost by Business Org: warehouse costs bucketed by departments
Database costs
The Database costs tab organizes your tenant’s database expenses for AWS S3 buckets managed by Snowflake, based on a 30-day rolling average.
- Database Cost by Month: Monthly database cost
- Database Cost Projections: Database cost projections for the contract periodℹ️Machine learning models compare past costs with trends to generate projections. For Cost Projection visuals, select Edit forecast to open Forecast properties.
- Database Cost by Database: A list of the costliest databases in descending order
- Delta In Database Cost Between Periods by Month: Monthly compute cost trends
- Database Cost by Schema: Database costs grouped by how your data’s organized in Snowflake
- Database Cost by Business Org: Database costs bucketed by departments
- Database Cost by Account: Total database costs by Snowflake account
- Data Transfer Cost by Account: Cost of moving data around your warehouse by Snowflake account
- Data Transfer Cost by Month: Monthly costs associated with data transmission for your Tenant
- Database Cost and Space Usage (TB) by Month: The bars represent storage size in terabytes (TB), while the line reflects database costs.ℹ️This widget is available only to the Tenant admin.
- Data Transfer Cost And Space Usage(TB) By Month: Monthly costs associated with data transmission and storage size in terabytes (TB).ℹ️This widget is available to Tenant admin only.
Use the pin icon to keep the Forecast properties visible.
Serverless costs
The Serverless Costs collates your resource allocations and pipeline costs.
- Auto Clustering Cost by Account: costs associated with automatically adjusting resources by Snowflake account
- Pipe Cost by Account: data pipeline costs segmented by their Snowflake account
- Auto Clustering Cost by Month: monthly automated resource allocation costs
- Pipe Cost by Month: monthly data pipeline costs
- Replication Cost by Month: monthly resource/data duplication costs
Cost breakdown report
Analyzing spend allocations can be tedious and complex. Slingshot’s Cost Breakdown Report simplifies this process by leveraging the power of tags to provide greater cost transparency for shared resources, enabling you to make more informed decisions. This report allows you to slice and dice Snowflake objects into logical groupings using tags, view cost insights, and download shareable cost breakdown reports.
By utilizing the Cost breakdown report, you’re able to get a clearer picture of cost attributions for shared resources. Slingshot tags provide a way to track spends and generate detailed reports that map to your business.
How do tags and the Cost breakdown report work together? Create, modify and assign new Tag Groups and values to Snowflake objects across all your Snowflake accounts. Once assigned, continue as usual while Slingshot tracks your Snowflake spend across various tag groups and reports those insights.
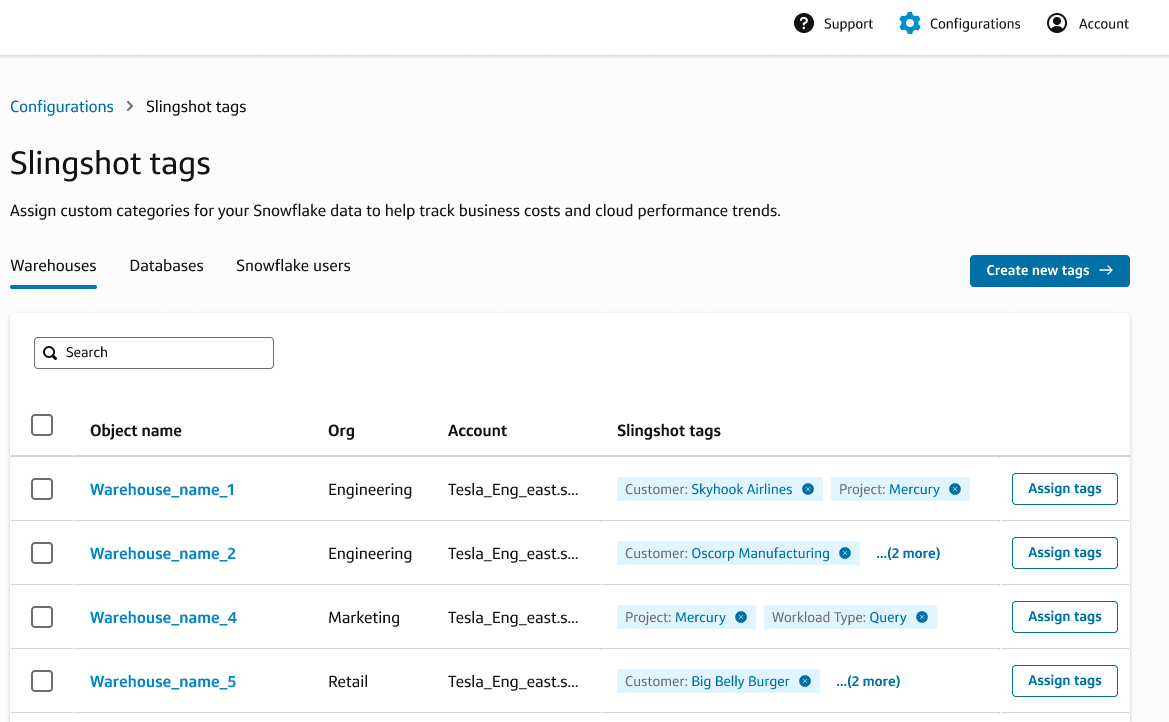
For example the VP of Data Engineering asks for cost reporting for all lines of business (LOBs). The problem is - the analytics warehouses used by Tableau are shared by multiple LOBs and their data analysts so the compute tagging alone won’t help in this scenario. Using Slingshot tags, the Data Engineering team create the following cost centers:
Tag group: Cost Center
Tag values for different LOBs: Acme Sales, Acme Engineering, Doppler Sales
Then the team assigns data analysts to the respective Cost Centers - solving the cost attribution problem across shared resources. This gives your VP of Data engineering the ability to filter the costs by the tag group Cost center and visualize compute, storage and other Snowflake usage costs by simply navigating to Slingshot dashboards and the Cost breakdown report.
Understanding the Cost breakdown report
Key Features
Tag-Based Grouping: The report uses tags to group Snowflake objects such as warehouses, users, and databases into logical units
Cost Insights: Provides detailed cost insights for each tag group
Shareable Reports: Generate shareable reports for your organization
How the report works
The Cost Breakdown Report aggregates the costs of objects (warehouses, users, and databases) tagged within a specific tag group over a selected date range. The report is limited to one tag group at a time and includes costs for objects explicitly tagged within that group.
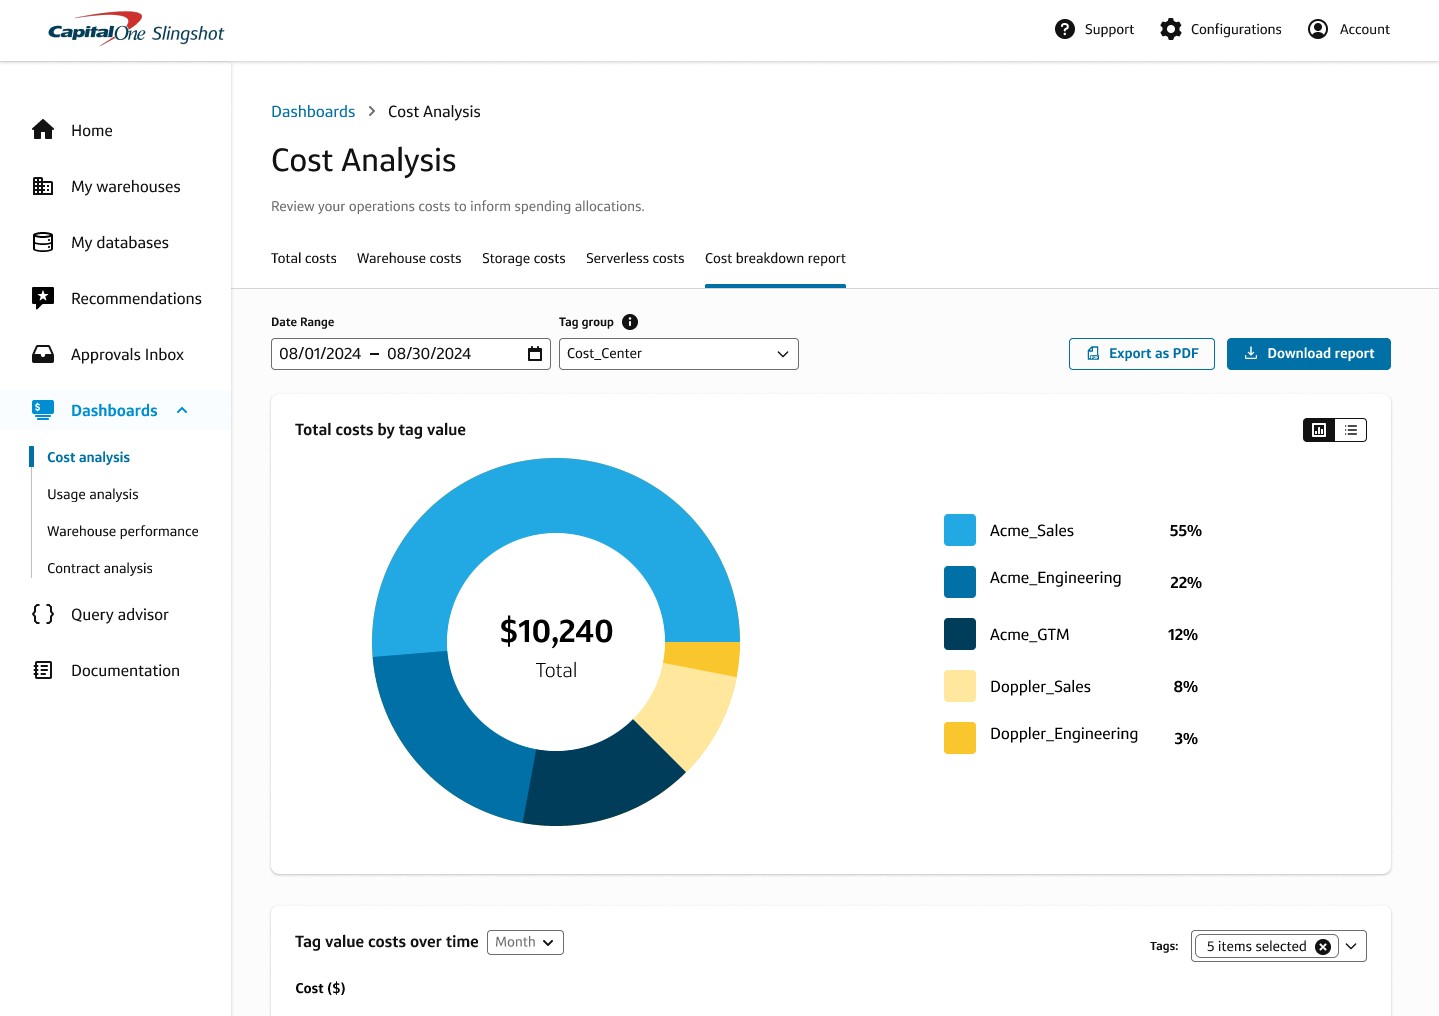
Let’s view the Cost breakdown report.
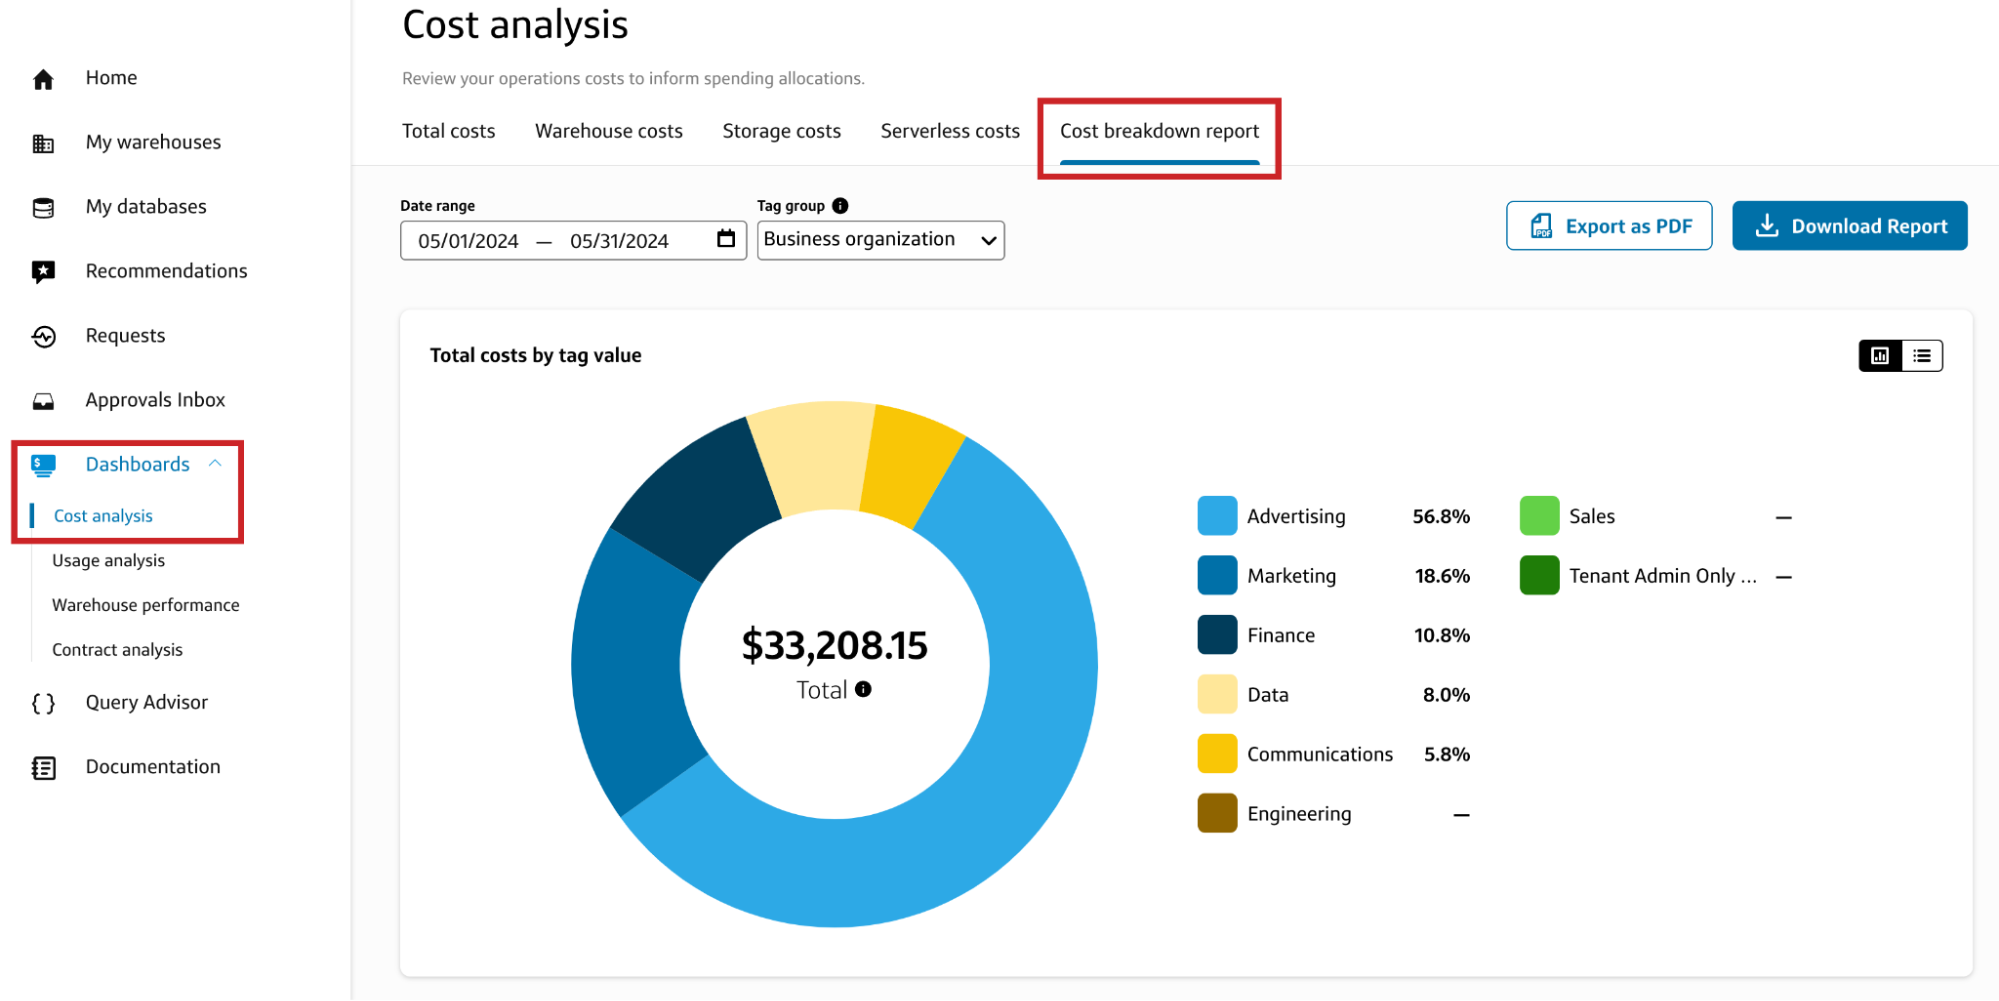
Expand Dashboards on the left navigation pane, select the Cost analysis dashboard.
Press the Cost breakdown report tab.
From here, adjust filters to focus on the desired allocations. Your selections update each visualization.
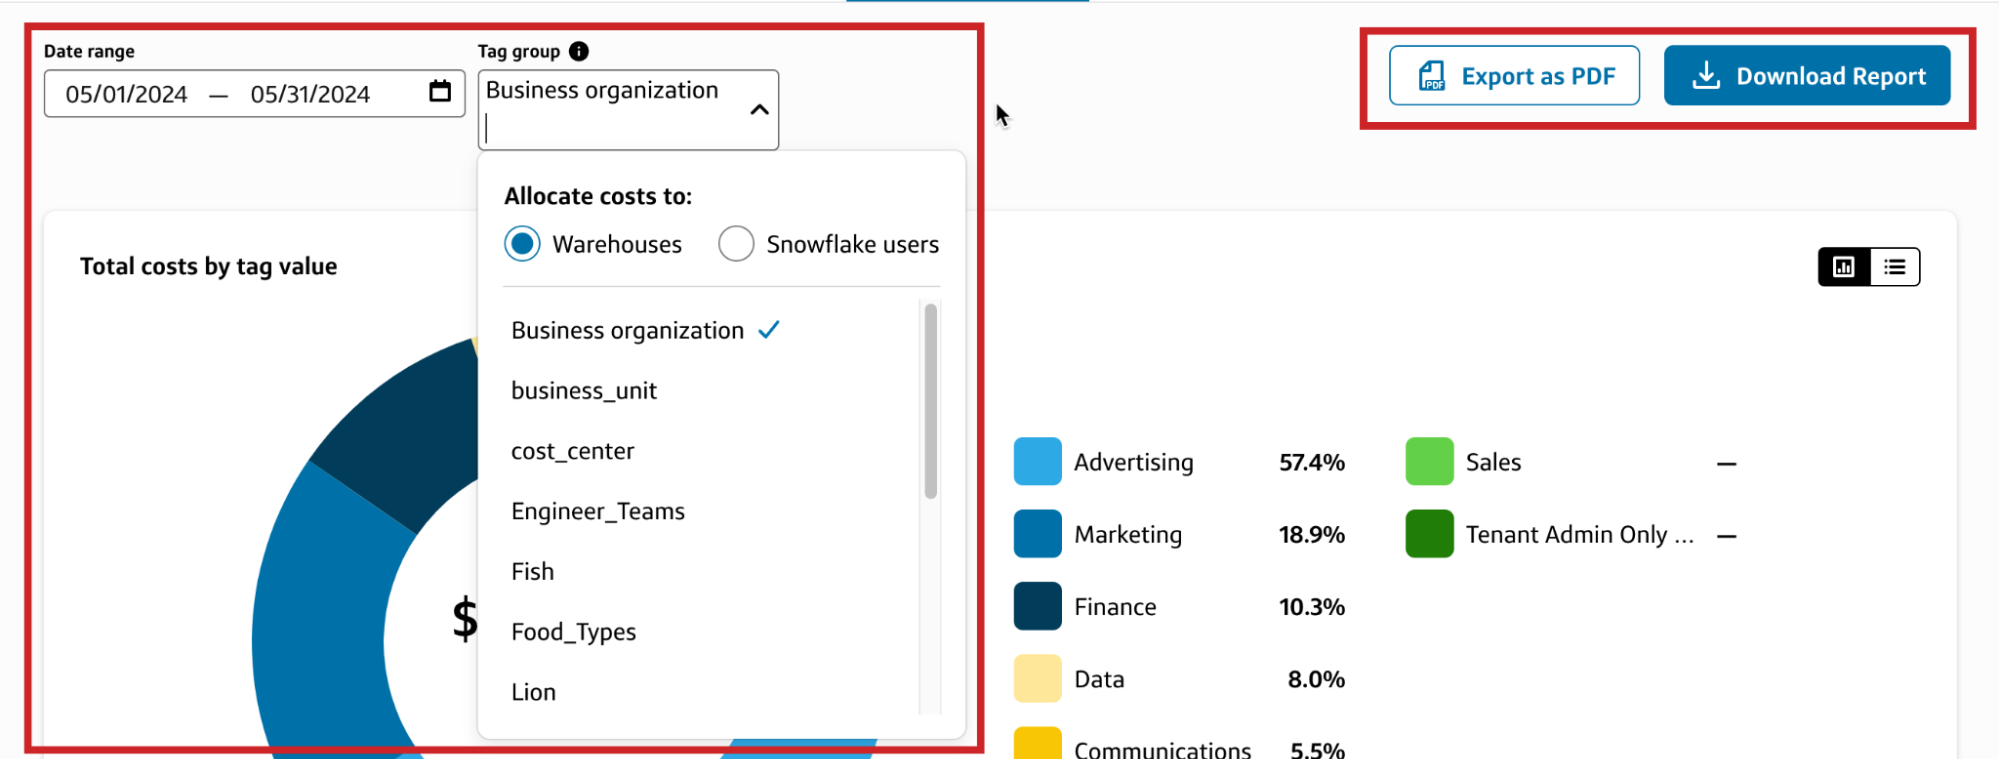
Date range
Tag group: Select warehouses or Snowflake users to view this allocation type
Warehouses + Databases: View the report by warehouse, which sums up the costs of all tagged warehouses and associated databases
Snowflake users + Databases: View the report by user with the total costs of all tagged users and associated databases
Export as a PDF: Download a snapshot of the visualizations. For a detailed report, download the .csv file.
Download Report to a zip file containing these 4 .csv files:
Cost Types Summary.csv
[Tag Group Name] Summary.csv
[Tag Group Name] Cost Types.csv
[Tag Group Name] Breakdown.csv
Total costs by tag value: View a pie chart or table

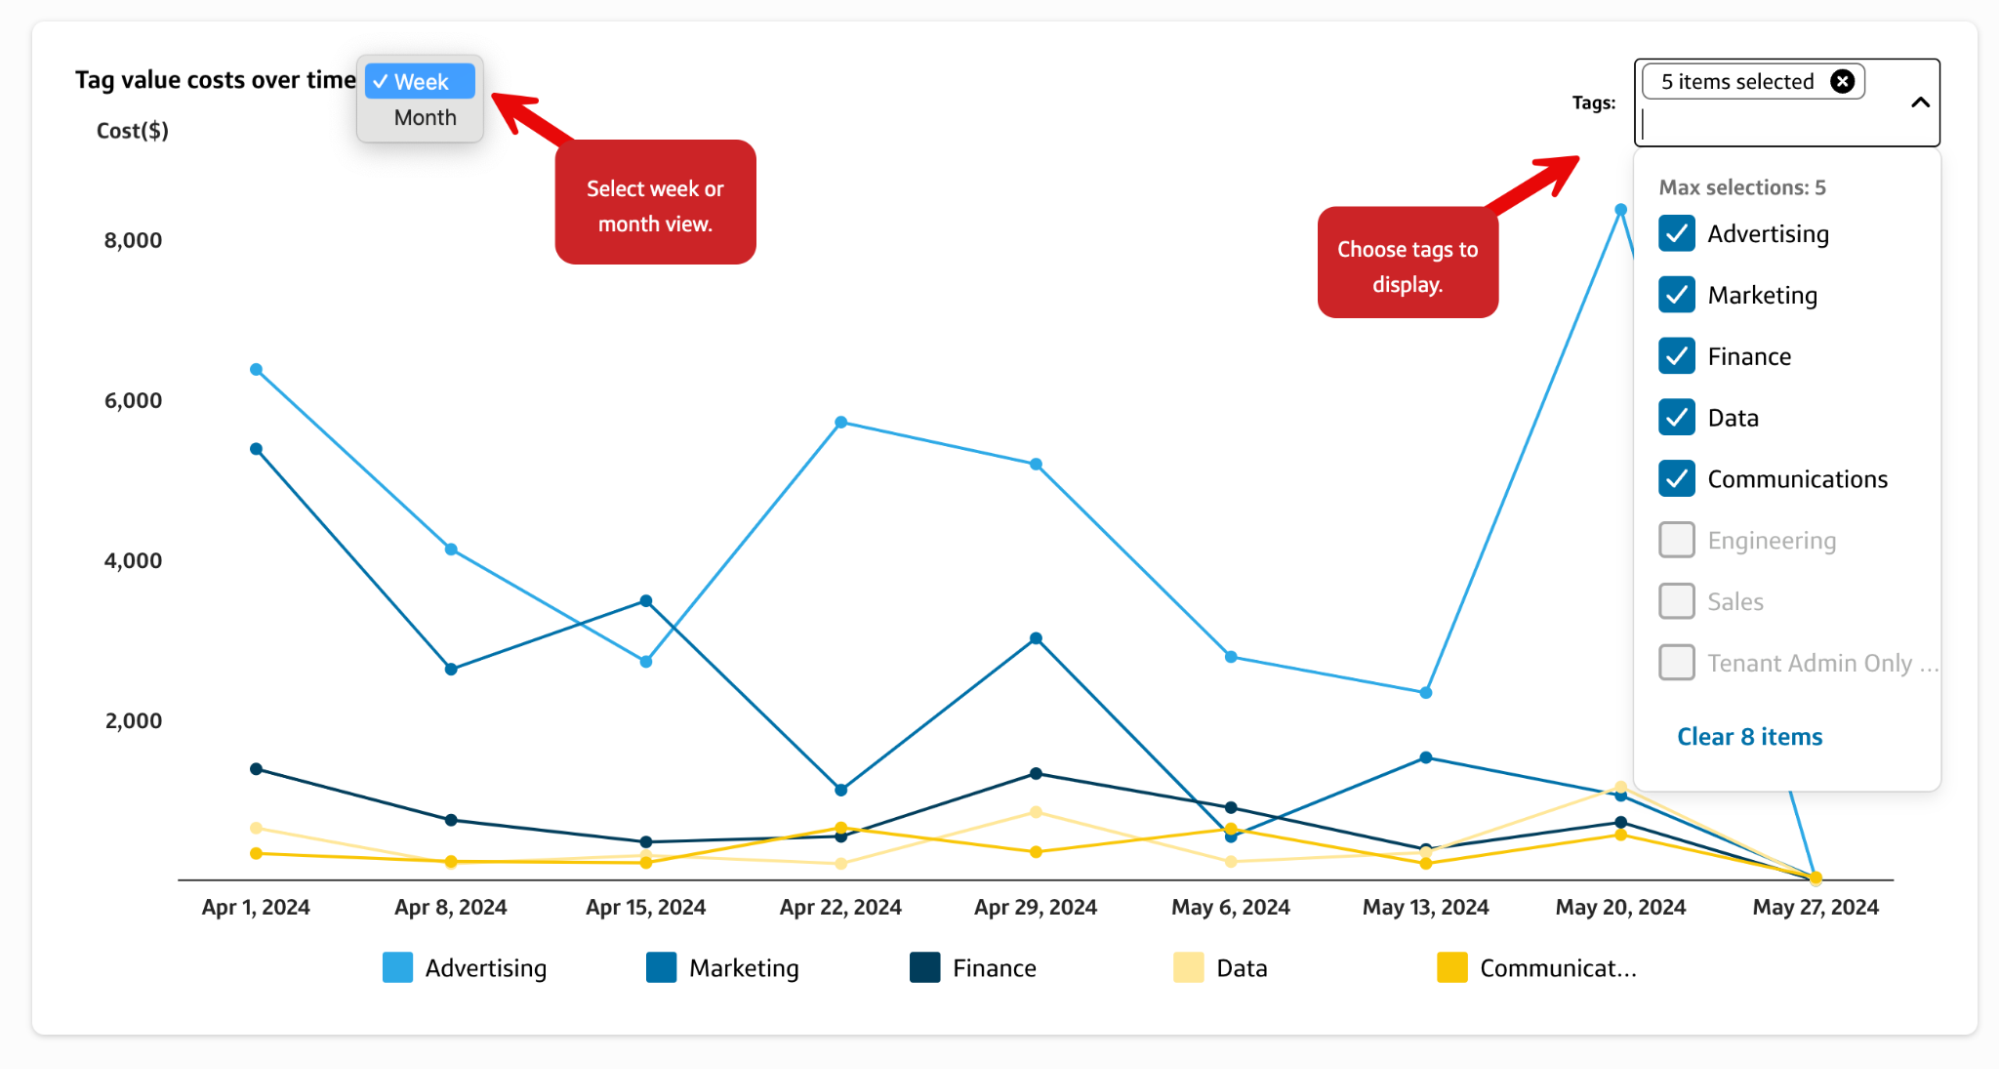
Tag value costs over time: Select a week or month along with the tags you’d like see displayed
Cost types by tag values: Choose tags from the drop-down list to highlight

Top warehouses by cost: a table view of your costliest warehouses

Editing forecast properties
Make adjustments to any projection visual with a few tweaks to the Forecast properties.
- Use the 3 dots to open the menu.
- Select Edit forecast.
- Adjust the Forecast properties.
- Use the Apply button to save your settings.
Adding filters
Want even more granular visual insights? Add filters. For Slingshot tags filters include:
- Date range: Set a date range
- Account name: Snowflake account name(s)
- Region: Available cloud regions
- Business orgs: Data for warehouses associated with a business org in Slingshot
Additional filters include
- Warehouses: Warehouses in your business org or unit
- Compute tags: Choose warehouses
- Databases: Databases in your business org
- Database tags: Snowflake database objects
To add filters,
- On any filter, set the parameters or select from the drop-down list.
- Press More Filters to make selections for Warehouses, Compute tags, Databases, and Database tags.
- Review your cost insights.
View or export summary data
Sometimes, you’d like to see a summary or need to download the insights information.
- Hover over a visual, 3 dots appear.
- Click the dots to see the options.
- Select View summary data to review the summary on the page.
Or - Select Export to CSV to generate a file with the insights.
FAQs
1. Why does the total cost of the tag group not match my Snowflake bill, even though all objects are tagged?
Expand
2. Can I assign multiple tags to objects?
Expand
3. Why does the total cost change when toggling between user-based and warehouse-based reports?
Expand
The allocation methods for Snowflake users and warehouses costs differ:
Warehouses: Costs are read directly from Snowflake views such as `WAREHOUSE_METERING_HISTORY`, `METERING_DAILY_HISTORY`, and `QUERY_ACCELERATION_HISTORY`.
Snowflake users: We use a proprietary “time-based model” that looks at all the query loads across a Warehouse and attribute their associated cost.
4. Why can’t I choose specific dates for my date range?
Expand
Snowflake has a one-year data retention policy. The date range is limited to the period for which complete data is available:
New Tenants: Up to one year back from the onboarding date
Existing Tenants: Approximately one year from the feature release date
5. Why is there no data for comparison/variance calculations in some cases?
Expand
The report will generate comparison calculations to display accurate insights when the comparison period has complete data - ensuring the accuracy of the variance calculations.
- Comparison Periods
The report compares costs based on a month-to-month model:
- Whole Month: If the selected range is from the first to the last day of a month, it compares to the same number of complete months in the previous period.
Example: January 1 - January 31 compared to December 1 - December 30.
- Partial Month: If the range starts on the first but ends mid-month, it compares to the same number of months plus days in the previous period.
Example: January 1 - January 6 compared to February 1 - February 6.
- Special Cases: For periods longer than the previous period.
Example: March 1 - March 29 compared to February 1 - February 28.
- Specified Range: If the range starts on a non-first day, it compares to the same number of days before the start of the range.
Example: January 2 - January 10 compared to 8 working days from January 2.