Creating warehouse performance notifications
by Joey Lane
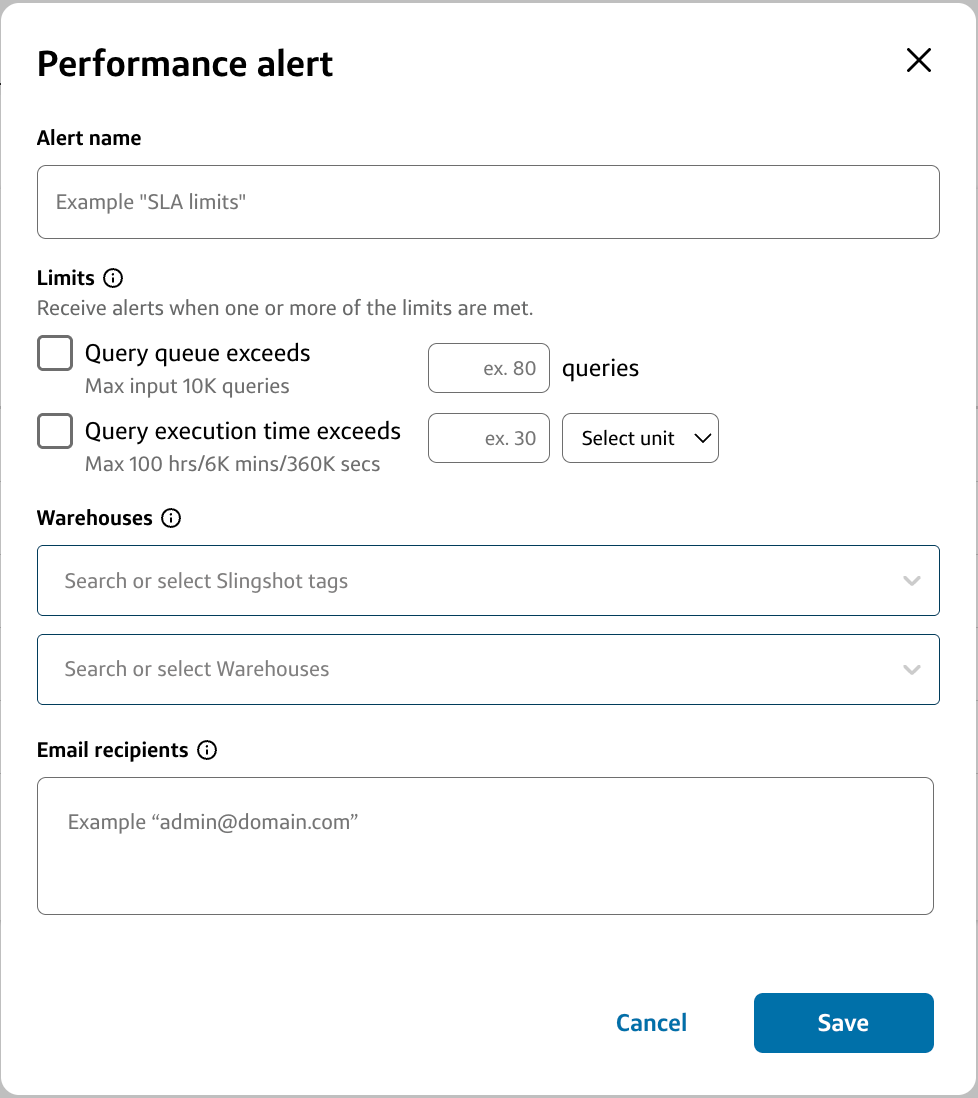
What are warehouse performance alerts?
In order to have more confidence in the quality of Slingshot’s schedule recommendations, you can now set custom performance thresholds to alert you (and/or any member of your teams) if a warehouse has experienced unexpected spikes in two key performance metrics: query queuing and query execution time.
You will be able to configure an alert for these metrics using the following three methods:
- After applying a recommendation, a modal will pop up asking if you want to set a performance alert on that warehouse. This allows you to ensure the new warehouse schedule is not performing anomalously.
- You can create or manage alerts for any warehouse at any time on the Snowflake Warehouses page.
- As a tenant admin, you can create alerts for groups of warehouses that are assigned to the same tag(s) on the Configurations page.
How should I determine performance thresholds for a given warehouse?
While determining performance thresholds is not an exact science, here are a few tips to help you ensure you are alerted about performance spikes that need attention (and avoid alerting about the ones that don’t):
Each of the thresholds have different implications for your warehouse performance:
- Query queuing: When a warehouse has a high number of queued queries, there is a delay for when a query is sent to a warehouse and when that query starts executing. This can result in longer wait times for queries to execute after being run. If response time for queries is especially important for a particular warehouse, we recommend setting a lower query queuing threshold.
- If your warehouse begins to breach the query queuing threshold, temporarily increasing the max cluster count might relieve this issue.
- Query execution time: This is the time it takes a query to execute after it begins running. If a warehouse has an important SLA in place, or a fast response time for queries on a warehouse is needed, we recommend setting a query execution time alert in line with your SLA.
- If your warehouse begins to breach the query execution time threshold, temporarily increasing the warehouse size or turning on QAS might relieve this issue.
- Query queuing: When a warehouse has a high number of queued queries, there is a delay for when a query is sent to a warehouse and when that query starts executing. This can result in longer wait times for queries to execute after being run. If response time for queries is especially important for a particular warehouse, we recommend setting a lower query queuing threshold.
You can use the following queries to find your maximum queuing and execution time over the last 30 days to help inform you thresholds:
Query queuing
set WAREHOUSE_NAME = '<NAME>'; -- change parameter

SELECT $WAREHOUSE_NAME AS WAREHOUSE_NAME, MAX (DELAYED) AS "Query Queue Exceeds"
FROM (Select DATE(START_TIME) as date, HOUR(START_TIME) as hour, count (query_id) as Delayed
FROM SNOWFLAKE.ACCOUNT_USAGE.QUERY_HISTORY
where QUEUED_OVERLOAD_TIME > 0
and START_TIME > CURRENT_DATE -30
AND WAREHOUSE_NAME = $WAREHOUSE_NAME
GROUP BY ALL)
Query execution time
set WAREHOUSE_NAME = '<NAME>'; -- change parameter

SELECT $WAREHOUSE_NAME AS WAREHOUSE_NAME, MAX(RUN_TIME_IN_MINS) AS "Query Execution Time Exceeds"
FROM (Select DATE(START_TIME) as date, HOUR(START_TIME) as hour,max (round ( (TOTAL_ELAPSED_TIME/60000),0 )) as RUN_TIME_IN_MINS FROM SNOWFLAKE.ACCOUNT_USAGE.QUERY_HISTORY
where START_TIME > CURRENT_DATE -30
AND WAREHOUSE_NAME = $WAREHOUSE_NAME
GROUP BY ALL)
For informed thresholds based on a specific warehouse’s historical performance, you can see a warehouse’s historical queuing and execution time on the Warehouse performance dashboard dashboard.
Once you’ve set your thresholds, if alerting is too frequent or infrequent, you can always increase or decrease your thresholds for a warehouse on the Warehouses page.
WITH query_hist AS
(
    SELECT
        tenant_id AS tenantid,
        account_locator,
        region,
        query_parameterized_hash,
        SUM(partitions_scanned) AS partitions_scanned,
        SUM(partitions_total) AS partitions_total,
        SUM(partitions_scanned) / SUM(partitions_total) AS fraction_scanned,
        SUM(bytes_scanned) / POWER(1024, 3) AS bytes_scanned_gb,
        SUM(execution_time) / COUNT(*) AS avg_execution_time
    FROM
        slingshot_db.slingshot.query_history
    WHERE
        tenantid IN ($tenants)
        AND start_time > CURRENT_DATE - 30
    GROUP BY
        tenantid,
        account_locator,
        region,
        query_parameterized_hash
    HAVING
        SUM(bytes_scanned) / POWER(1024, 3) > 1
        AND SUM(partitions_scanned) / SUM(partitions_total) > 0.8
),
query_attr AS
(
    SELECT
        tenantid,
        account_locator,
        region,
        query_parameterized_hash,
        COUNT(*) AS total_executions,
        SUM(COALESCE(credits_attributed_compute, 0) + COALESCE(credits_used_query_acceleration, 0)) AS total_credits
    FROM
        slingshot_db.slingshot.query_attribution_history
    WHERE
        tenantid IN ($tenants)
        AND start_time > CURRENT_DATE - 30
        AND query_parameterized_hash IS NOT NULL
    GROUP BY
        tenantid,
        account_locator,
        region,
        query_parameterized_hash
),
ranked_queries AS
(
    SELECT
        h.tenantid,
        h.account_locator,
        h.region,
        h.query_parameterized_hash,
        h.partitions_scanned,
        h.partitions_total,
        h.fraction_scanned,
        h.bytes_scanned_gb,
        h.avg_execution_time,
        a.total_executions,
        a.total_credits,
        ROW_NUMBER() OVER (PARTITION BY h.tenantid ORDER BY h.bytes_scanned_gb DESC) AS rank
    FROM
        query_hist h
    INNER JOIN
        query_attr a
    ON
        h.tenantid = a.tenantid
        AND h.account_locator = a.account_locator
        AND h.region = a.region
        AND h.query_parameterized_hash = a.query_parameterized_hash
)
SELECT
    account_locator,
    region,
    query_parameterized_hash,
    partitions_scanned,
    partitions_total,
    fraction_scanned,
    bytes_scanned_gb,
    avg_execution_time,
    total_executions,
    total_credits
FROM
    ranked_queries
WHERE
    rank <= 100;